It plots an effect, direct or indirect, against a moderator, with confidence band if available.
Usage
plot_effect_vs_w(
  object,
  w = NULL,
  w_label = NULL,
  effect_label = NULL,
  add_zero_line = TRUE,
  always_draw_zero_line = FALSE,
  line_linewidth = 1,
  line_color = "blue",
  shade_the_band = TRUE,
  draw_the_intervals = TRUE,
  band_fill_color = "lightgrey",
  band_alpha = 0.5,
  intervals_color = "black",
  intervals_linetype = "longdash",
  intervals_linewidth = 1,
  zero_line_color = "grey",
  zero_line_linewidth = 1,
  zero_line_linetype = "solid",
  line_args = list(),
  band_args = list(),
  intervals_args = list(),
  zero_line_args = list(),
  level = 0.95
)

fill_wlevels(to_fill, cond_out = NULL, k = 21)
Arguments
- object
The output of
cond_indirect_effects().- w
The name of the moderator. Must be present in
object. IfNULL, the default, andobjecthas only one moderator, then it will be set to that moderator. Because this function currently only supports a path with only one moderator, this argument can be left asNULLfor now.- w_label
The label of the horizontal axis. If
NULL, the default, it will bepaste0("Moderator: ", w).- effect_label
The label of the vertical axis. If
NULL, the default, it will be generated from the path.- add_zero_line
Whether a horizontal line at zero will be drawn. Default is
TRUE.- always_draw_zero_line
If
FALSE, the default, then the line at zero, if requested will be drawn only if zero is within the range of the plot. IfTRUE, then the line at zero will always be drawn.- line_linewidth
The width of the line of the effect for each level of the moderator, to be used by
ggplot2::geom_line(). Default is 1. Always overrides the value ofline_args.- line_color
The color of the line of the effect for each level of the moderator, to be used by
ggplot2::geom_line(). Default is "blue". Always overrides the value ofline_args.- shade_the_band
If
TRUE, the default, a confidence band will be drawn as a region along the line if confidence intervals can be retrieved fromobject.- draw_the_intervals
If
TRUE, the default, two lines will be drawn for the confidence intervals along the line if they can be retrieved fromobject.- band_fill_color
The color of of the confidence band, to be used by
ggplot2::geom_ribbon(). Default is "lightgrey". Always overrides the value ofband_args.- band_alpha
A number from 0 to 1 for the level of transparency of the confidence band, to be used by
ggplot2::geom_ribbon(). Default is.50. Always overrides the value ofband_args.- intervals_color
The color of the lines of the confidence intervals, to be used by
ggplot2::geom_line(). Default is"black". Always overrides the value ofintervals_args.- intervals_linetype
The line type of the lines of the confidence intervals, to be used by
ggplot2::geom_line(). Default is"longdash". Always overrides the value ofintervals_args.- intervals_linewidth
The line width of the lines of the confidence intervals, to be used by
ggplot2::geom_line(). Default is 1. Always overrides the value ofintervals_args.- zero_line_color
The color of the line at zero, to be used by
ggplot2::geom_line(). Default is"grey". Always overrides the value ofzero_line_args.- zero_line_linewidth
The line width of the line at zero, to be used by
ggplot2::geom_line(). Default is 1. Always overrides the value ofzero_line_args.- zero_line_linetype
The line type of the line at zero, to be used by
ggplot2::geom_line(). Default is"solid". Always overrides the value ofzero_line_args.- line_args
A named list of additional arguments to be passed to
ggplot2::geom_line()for the line of the effect against moderator. Default islist().- band_args
A named list of additional arguments to be passed to
ggplot2::geom_ribbon()for the confidence band. Default islist().- intervals_args
A named list of additional arguments to be passed to
ggplot2::geom_line()for the lines of confidence intervals. Default islist().- zero_line_args
A named list of additional arguments to be passed to
ggplot2::geom_line()for the line at zero. Default islist().- level
The level of confidence for the confidence intervals computed from the original standard errors. Used only for paths without mediators and both
x- andy-variables are not standardized.- to_fill
The output of
cond_indirect_effects()orpseudo_johnson_neyman(), for which additional levels of the moderator will be added.- cond_out
If
to_fillis the output ofpseudo_johnson_neyman(), the original output ofcond_indirect_effects()used in the call topseudo_johnson_neyman()need to be supplied through this argument.- k
The desired number of levels of the moderator.
Value
plot_effect_vs_w() returns a
ggplot2 graph. Plotted if
not assigned to a name. It can be
further modified like a usual
ggplot2 graph.
fill_wlevels() returns an updated
output of cond_indirect_effects()
with the desired number of levels of
the moderator.
Details
It receives an output
of cond_indirect_effects() and
plot the effect against the
moderator. The effect can be an
indirect effect or a direct effect.
It uses the levels of the moderator
stored in the output of
cond_indirect_effects(). Therefore,
the desired levels of the moderator
to be plotted needs to be specified
when calling cond_indirect_effects(),
as illustrated in the example.
Currently, this function only supports a path with exactly one moderator, and the moderator is a numeric variable.
Using Original Standard Errors
If the following conditions are met, the stored standard errors, if available, will be used to form the confidence intervals:
Confidence intervals have not been formed (e.g., by bootstrapping or Monte Carlo).
The path has no mediators.
The model has only one group.
The path is moderated by one or more moderator.
Both the
x-variable and they-variable are not standardized.
If the model is fitted by OLS
regression (e.g., using stats::lm()),
then the variance-covariance matrix
of the coefficient estimates will be
used, and confidence
intervals are computed from the t
statistic.
If the model is fitted by structural
equation modeling using lavaan, then
the variance-covariance computed by
lavaan will be used,
and confidence intervals are computed
from the z statistic.
Caution
If the model is fitted by structural equation modeling and has moderators, the standard errors, p-values, and confidence interval computed from the variance-covariance matrices for conditional effects can only be trusted if all covariances involving the product terms are free. If any of them are fixed, for example, fixed to zero, it is possible that the model is not invariant to linear transformation of the variables.
The function fill_wlevels() is
a helper to automatically
fill in additional levels
of the moderators, to plot a graph
with smooth confidence band. It
accepts the output of cond_indirect_effects()
or pseudo_johnson_neyman(), finds
the range of the values of the
moderator, and returns an output
of cond_indirect_effects() with
the desired number of levels within
this range. It is intended to be a
helper. If it does not work, users
can still get the desired number of
levels by setting the values manually
when calling cond_indirect_effects().
Examples
dat <- data_med_mod_a
lm_m <- lm(m ~ x*w + c1 + c2, dat)
lm_y <- lm(y ~ m + x + c1 + c2, dat)
fit_lm <- lm2list(lm_m, lm_y)
# Set R to a large value in real research.
boot_out_lm <- do_boot(fit_lm,
R = 50,
seed = 54532,
parallel = FALSE,
progress = FALSE)
# Compute the conditional indirect effects
# from 2 SD below mean to 2 SD above mean of the moderator,
# by setting sd_from_mean of cond_indirect_effects().
# Set length.out to a larger number for a smooth graph.
out_lm <- cond_indirect_effects(wlevels = "w",
x = "x",
y = "y",
m = "m",
fit = fit_lm,
sd_from_mean = seq(-2, 2, length.out = 10),
boot_ci = TRUE,
boot_out = boot_out_lm)
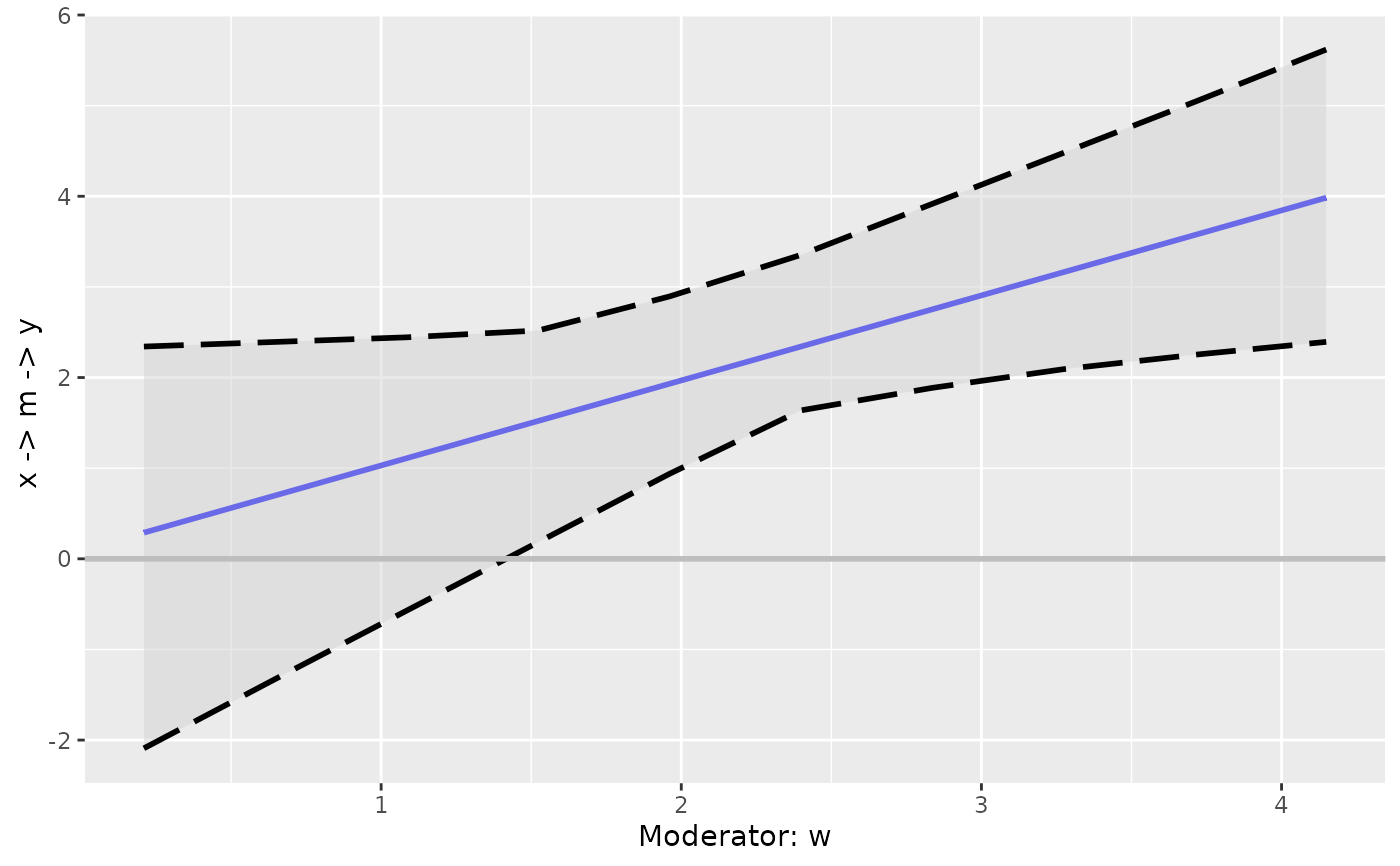
p <- plot_effect_vs_w(out_lm)
p
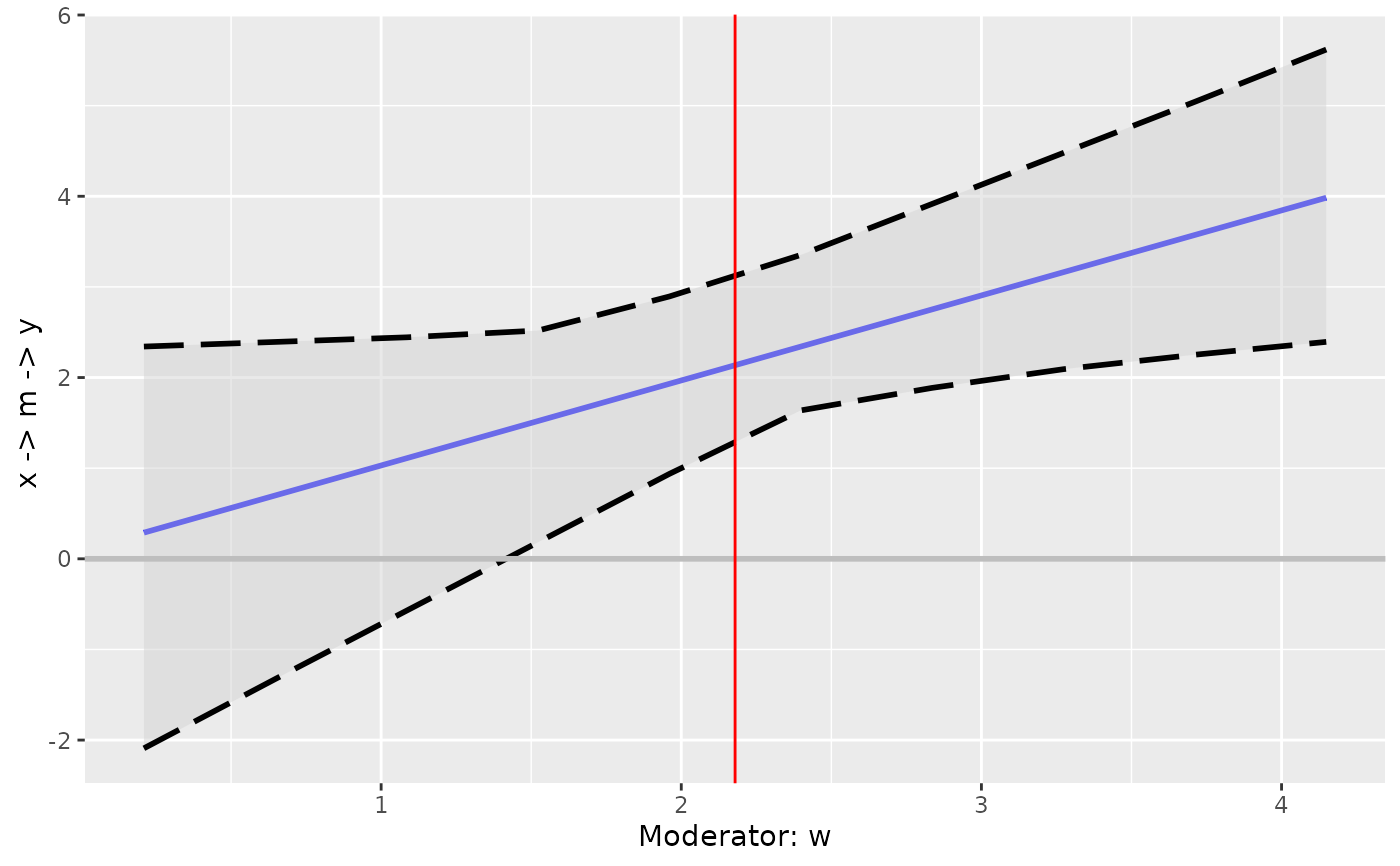
 # The output is a ggplot2 graph and so can be further customized
library(ggplot2)
# Add the line for the mean of w, the moderator
p2 <- p + geom_vline(xintercept = mean(dat$w),
color = "red")
p2
# The output is a ggplot2 graph and so can be further customized
library(ggplot2)
# Add the line for the mean of w, the moderator
p2 <- p + geom_vline(xintercept = mean(dat$w),
color = "red")
p2
 # Use fill_wlevels to add moderator levels:
dat <- data_med_mod_a
lm_m <- lm(m ~ x*w + c1 + c2, dat)
lm_y <- lm(y ~ m + x + c1 + c2, dat)
fit_lm <- lm2list(lm_m, lm_y)
wlevels <- mod_levels(w = "w",
sd_from_mean = c(-3, 0, 3),
fit = fit_lm)
wlevels
#> w
#> M+3.0SD 5.1338282
#> Mean 2.1792785
#> M-3.0SD -0.7752712
cond_out <- cond_indirect_effects(wlevels = wlevels,
x = "x",
y = "m",
fit = fit_lm)
cond_out
#>
#> == Conditional effects ==
#>
#> Path: x -> m
#> Conditional on moderator(s): w
#> Moderator(s) represented by: w
#>
#> [w] (w) ind SE Stat pvalue Sig CI.lo CI.hi
#> 1 M+3.0SD 5.134 5.119 1.428 3.584 0.001 *** 2.283 7.955
#> 2 Mean 2.179 2.228 0.457 4.874 0.000 *** 1.321 3.136
#> 3 M-3.0SD -0.775 -0.663 1.546 -0.429 0.669 -3.733 2.407
#>
#> - [SE] are regression standard errors.
#> - [Stat] are the t statistics used to test the effects.
#> - [pvalue] are p-values computed from 'Stat'.
#> - [Sig]: 0 ‘***’ 0.001 ‘**’ 0.01 ‘*’ 0.05 ‘ ’ 1.
#> - [CI.lo to CI.hi] are 95.0% confidence interval computed from
#> regression standard errors.
#> - The 'ind' column shows the conditional effects.
#>
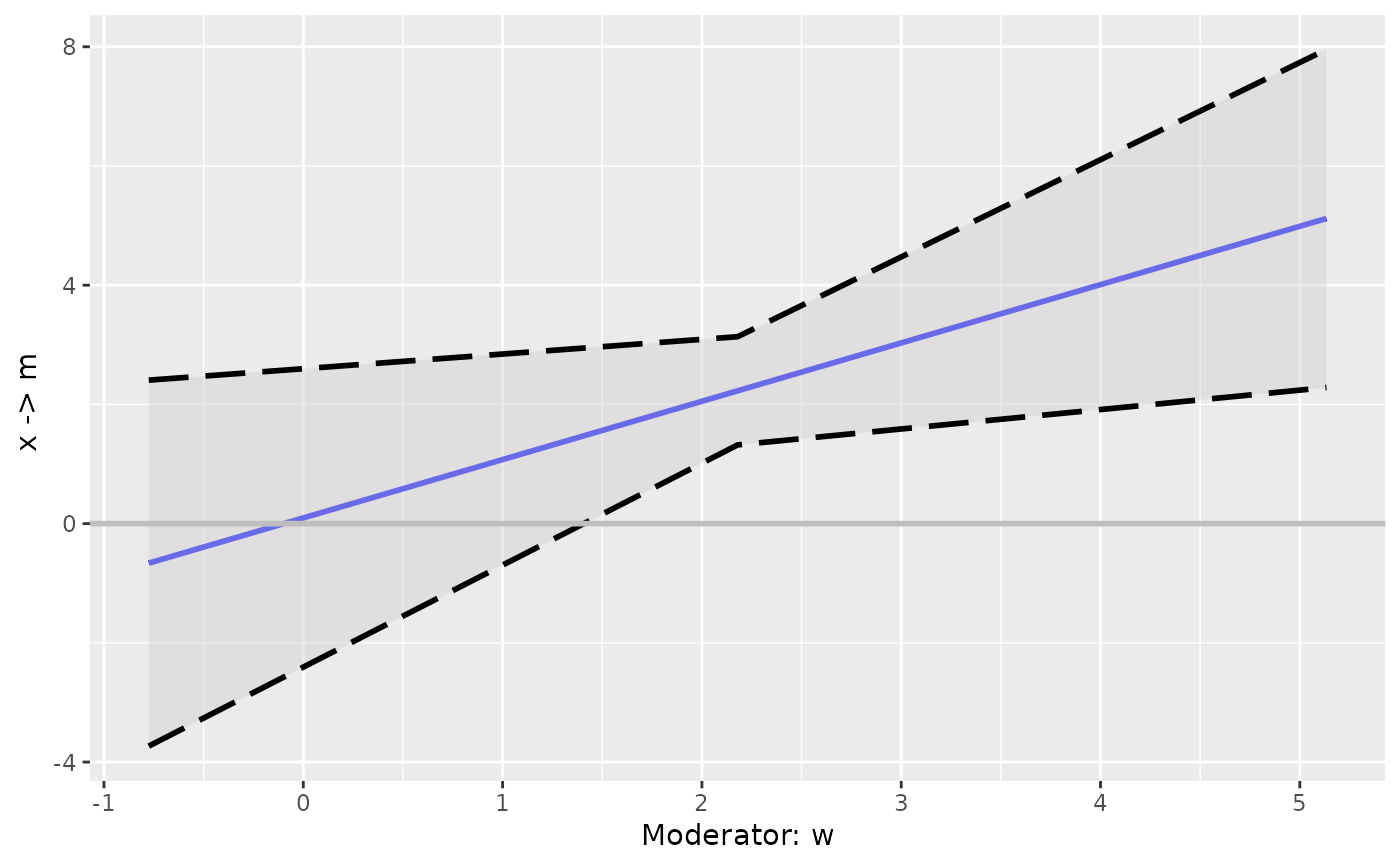
# Only 3 points
p1 <- plot_effect_vs_w(cond_out)
p1
# Use fill_wlevels to add moderator levels:
dat <- data_med_mod_a
lm_m <- lm(m ~ x*w + c1 + c2, dat)
lm_y <- lm(y ~ m + x + c1 + c2, dat)
fit_lm <- lm2list(lm_m, lm_y)
wlevels <- mod_levels(w = "w",
sd_from_mean = c(-3, 0, 3),
fit = fit_lm)
wlevels
#> w
#> M+3.0SD 5.1338282
#> Mean 2.1792785
#> M-3.0SD -0.7752712
cond_out <- cond_indirect_effects(wlevels = wlevels,
x = "x",
y = "m",
fit = fit_lm)
cond_out
#>
#> == Conditional effects ==
#>
#> Path: x -> m
#> Conditional on moderator(s): w
#> Moderator(s) represented by: w
#>
#> [w] (w) ind SE Stat pvalue Sig CI.lo CI.hi
#> 1 M+3.0SD 5.134 5.119 1.428 3.584 0.001 *** 2.283 7.955
#> 2 Mean 2.179 2.228 0.457 4.874 0.000 *** 1.321 3.136
#> 3 M-3.0SD -0.775 -0.663 1.546 -0.429 0.669 -3.733 2.407
#>
#> - [SE] are regression standard errors.
#> - [Stat] are the t statistics used to test the effects.
#> - [pvalue] are p-values computed from 'Stat'.
#> - [Sig]: 0 ‘***’ 0.001 ‘**’ 0.01 ‘*’ 0.05 ‘ ’ 1.
#> - [CI.lo to CI.hi] are 95.0% confidence interval computed from
#> regression standard errors.
#> - The 'ind' column shows the conditional effects.
#>
# Only 3 points
p1 <- plot_effect_vs_w(cond_out)
p1
 # Increase the number of levels to 15
cond_out_filled <- fill_wlevels(cond_out,
k = 15)
cond_out_filled
#>
#> == Conditional effects ==
#>
#> Path: x -> m
#> Conditional on moderator(s): w
#> Moderator(s) represented by: w
#>
#> [w] (w) ind SE Stat pvalue Sig CI.lo CI.hi
#> 1 5.13382823045524 5.134 5.119 1.428 3.584 0.001 *** 2.283 7.955
#> 2 4.71174970320561 4.712 4.706 1.238 3.801 0.000 *** 2.248 7.164
#> 3 4.28967117595598 4.290 4.293 1.052 4.080 0.000 *** 2.204 6.383
#> 4 3.86759264870635 3.868 3.880 0.874 4.439 0.000 *** 2.145 5.616
#> 5 3.44551412145672 3.446 3.467 0.709 4.892 0.000 *** 2.060 4.875
#> 6 3.0234355942071 3.023 3.054 0.568 5.377 0.000 *** 1.926 4.182
#> 7 2.60135706695747 2.601 2.641 0.474 5.569 0.000 *** 1.700 3.583
#> 8 2.17927853970784 2.179 2.228 0.457 4.874 0.000 *** 1.321 3.136
#> 9 1.75720001245821 1.757 1.815 0.524 3.462 0.001 *** 0.774 2.857
#> 10 1.33512148520858 1.335 1.402 0.650 2.156 0.034 * 0.111 2.693
#> 11 0.913042957958955 0.913 0.989 0.808 1.225 0.224 -0.615 2.593
#> 12 0.490964430709327 0.491 0.576 0.982 0.587 0.559 -1.373 2.526
#> 13 0.068885903459699 0.069 0.163 1.165 0.140 0.889 -2.150 2.477
#> 14 -0.353192623789929 -0.353 -0.250 1.354 -0.184 0.854 -2.938 2.439
#> 15 -0.775271151039557 -0.775 -0.663 1.546 -0.429 0.669 -3.733 2.407
#>
#> - [SE] are regression standard errors.
#> - [Stat] are the t statistics used to test the effects.
#> - [pvalue] are p-values computed from 'Stat'.
#> - [Sig]: 0 ‘***’ 0.001 ‘**’ 0.01 ‘*’ 0.05 ‘ ’ 1.
#> - [CI.lo to CI.hi] are 95.0% confidence interval computed from
#> regression standard errors.
#> - The 'ind' column shows the conditional effects.
#>
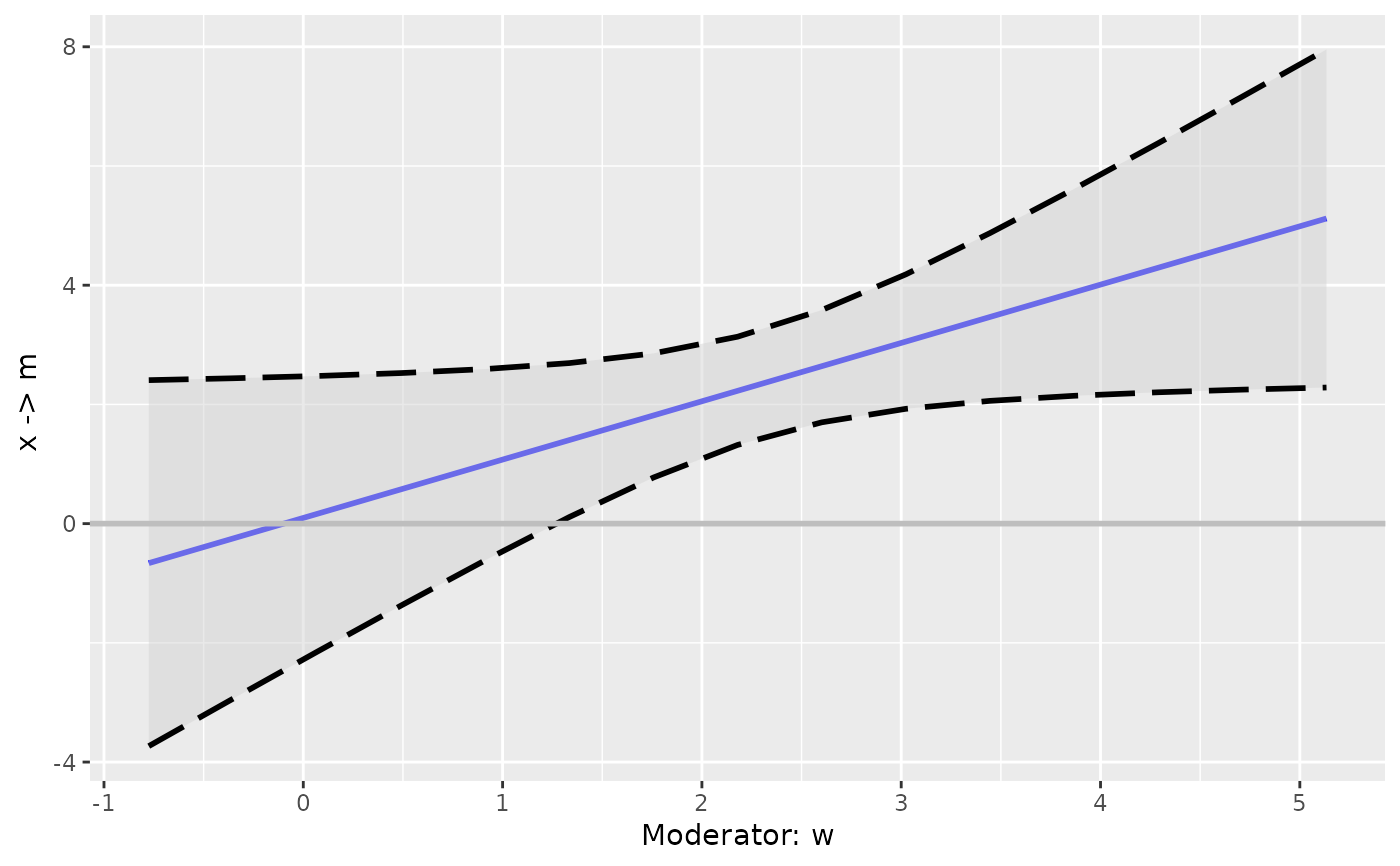
p2 <- plot_effect_vs_w(cond_out_filled)
p2
# Increase the number of levels to 15
cond_out_filled <- fill_wlevels(cond_out,
k = 15)
cond_out_filled
#>
#> == Conditional effects ==
#>
#> Path: x -> m
#> Conditional on moderator(s): w
#> Moderator(s) represented by: w
#>
#> [w] (w) ind SE Stat pvalue Sig CI.lo CI.hi
#> 1 5.13382823045524 5.134 5.119 1.428 3.584 0.001 *** 2.283 7.955
#> 2 4.71174970320561 4.712 4.706 1.238 3.801 0.000 *** 2.248 7.164
#> 3 4.28967117595598 4.290 4.293 1.052 4.080 0.000 *** 2.204 6.383
#> 4 3.86759264870635 3.868 3.880 0.874 4.439 0.000 *** 2.145 5.616
#> 5 3.44551412145672 3.446 3.467 0.709 4.892 0.000 *** 2.060 4.875
#> 6 3.0234355942071 3.023 3.054 0.568 5.377 0.000 *** 1.926 4.182
#> 7 2.60135706695747 2.601 2.641 0.474 5.569 0.000 *** 1.700 3.583
#> 8 2.17927853970784 2.179 2.228 0.457 4.874 0.000 *** 1.321 3.136
#> 9 1.75720001245821 1.757 1.815 0.524 3.462 0.001 *** 0.774 2.857
#> 10 1.33512148520858 1.335 1.402 0.650 2.156 0.034 * 0.111 2.693
#> 11 0.913042957958955 0.913 0.989 0.808 1.225 0.224 -0.615 2.593
#> 12 0.490964430709327 0.491 0.576 0.982 0.587 0.559 -1.373 2.526
#> 13 0.068885903459699 0.069 0.163 1.165 0.140 0.889 -2.150 2.477
#> 14 -0.353192623789929 -0.353 -0.250 1.354 -0.184 0.854 -2.938 2.439
#> 15 -0.775271151039557 -0.775 -0.663 1.546 -0.429 0.669 -3.733 2.407
#>
#> - [SE] are regression standard errors.
#> - [Stat] are the t statistics used to test the effects.
#> - [pvalue] are p-values computed from 'Stat'.
#> - [Sig]: 0 ‘***’ 0.001 ‘**’ 0.01 ‘*’ 0.05 ‘ ’ 1.
#> - [CI.lo to CI.hi] are 95.0% confidence interval computed from
#> regression standard errors.
#> - The 'ind' column shows the conditional effects.
#>
p2 <- plot_effect_vs_w(cond_out_filled)
p2