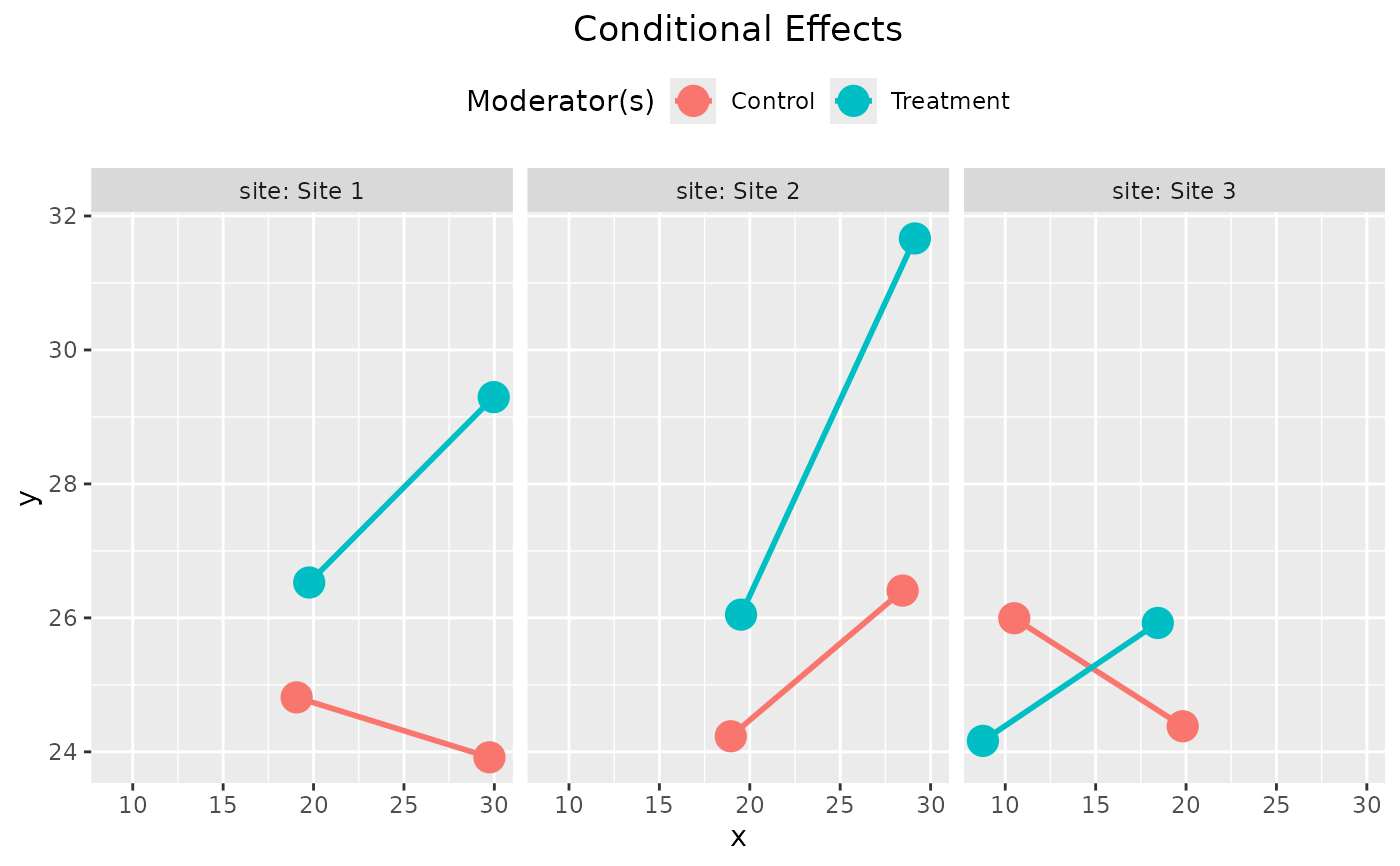
A two-moderator model, both categorical.
Format
A data frame with 600 rows and 6 variables:
- y
Outcome variable. Numeric.
- x
Predictor. Numeric.
- gp
Moderator 1. String: "Control" and "Treatment".
- site
Moderator 2. String: "Site 1", "Site 2", and "Site 3".
- c1
Control variable. Numeric.
- c2
Control variable. Numeric.
Examples
data(data_mod_cat_2w)
lm_out <- lm(y ~ x*gp + x*site + c1 + c2, data_mod_cat_2w)
out <- cond_effects(
  wlevels = c("site", "gp"),
  x = "x",
  fit = lm_out
)
out
#>
#> == Conditional effects ==
#>
#>  Path: x -> y
#>  Conditional on moderator(s): site, gp
#>  Moderator(s) represented by: siteSite 2, siteSite 3, gpTreatment
#>  Computation Formula:
#>    (b.y~x + (b.x:gpTreatment)*(gpTreatment) + (b.x:siteSite
#>    2)*(siteSite 2) + (b.x:siteSite 3)*(siteSite 3))
#>
#>   [site]      [gp] (siteSite 2) (siteSite 3) (gpTreatment)    ind    SE   Stat
#> 1 Site 1 Control              0            0             0 -0.084 0.060 -1.409
#> 2 Site 1 Treatment            0            0             1  0.271 0.060  4.543
#> 3 Site 2 Control              1            0             0  0.229 0.065  3.527
#> 4 Site 2 Treatment            1            0             1  0.584 0.064  9.146
#> 5 Site 3 Control              0            1             0 -0.173 0.067 -2.592
#> 6 Site 3 Treatment            0            1             1  0.182 0.062  2.936
#>   pvalue Sig  CI.lo  CI.hi
#> 1  0.159     -0.201  0.033
#> 2  0.000 ***  0.154  0.388
#> 3  0.000 ***  0.101  0.356
#> 4  0.000 ***  0.459  0.709
#> 5  0.010 **  -0.304 -0.042
#> 6  0.003 **   0.060  0.304
#>
#>  - [SE] are regression standard errors.
#>  - [Stat] are the t statistics used to test the effects.
#>  - [pvalue] are p-values computed from 'Stat'.
#>  - [Sig]: 0 ‘***’ 0.001 ‘**’ 0.01 ‘*’ 0.05 ‘ ’ 1.
#>  - [CI.lo to CI.hi] are 95.0% confidence interval computed from
#>    regression standard errors.
#>  - The 'ind' column shows the conditional effects.
#>   - Call ‘print_all_cond_indirect_effects()’ to print the detailed
#>    outputs of all levels.
#>
plot(out, facet_grid_cols = "site", graph_type = "tumble")