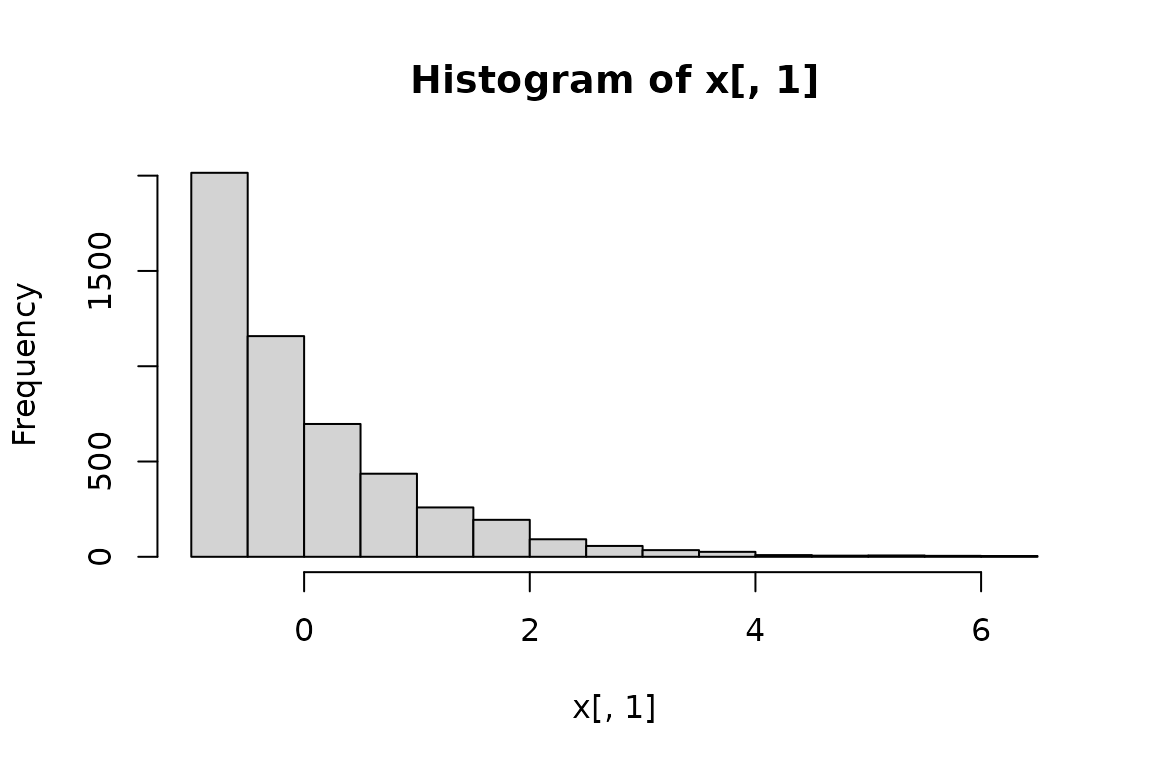
Generate multivariate random numbers using the IG method.
Arguments
- n
The number of cases to generate.
- sigma
The population covariance matrix. It is recommended to supply a correlation matrix (with diagonal elements equal to one). The numbers will be rescaled to have population means and SDs specified by
pmeanandpsd, respectively.- skew
A numeric vector of the population skewness coefficients. If it is a scalar, its value will be used as the population skewness of all variables to be generated.
- kurt
A numeric vector of the population excess kurtosis coefficients. If it is a scalar, its value will be used as the population excess kurtosis coefficients. of all variables to be generated.
- rIG_args
A list of extra arguments to be passed to
covsim::rIG().- pmean
A numeric vector population means. If it is a scalar, its value will be used as the population means of all variables to be generated.
- psd
A numeric vector of population standard deviations. If it is a scalar, its value will be used as the population standard deviations of all variables to be generated.
Details
First, random numbers will be generated
using covsim::rIG(), with the specified
target population marginal skewness and
excess kurtosis.
The random numbers will then be
rescaled with the desired population
means and standard deviations.
References
Foldnes, N. and Olson, U. H. (2016). A simple simulation technique for nonnormal data with prespecified skewness, kurtosis, and covariance matrix. Multivariate Behavioral Research, 51(2–3), 207–219. doi:10.1080/00273171.2015.1133274