Moderation Effects Plots by plotmod()
Shu Fai Cheung
2026-07-24
Source:vignettes/plotmod.Rmd
plotmod.RmdFor computing conditional effects and plotting conditional effects in regression models, it is recommended to use the package
manymome. It has more comprehensive support thanstdmod. See these articles for some demonstration. The package also supports moderation in structural equation models fitted bylavaan, which is not supported instdmod.
Introduction
This vignette illustrates how to use plotmod() from the
stdmod package. More about this package can be found in
vignette("stdmod", package = "stdmod") or at https://sfcheung.github.io/stdmod/.
What plotmod() Can Do
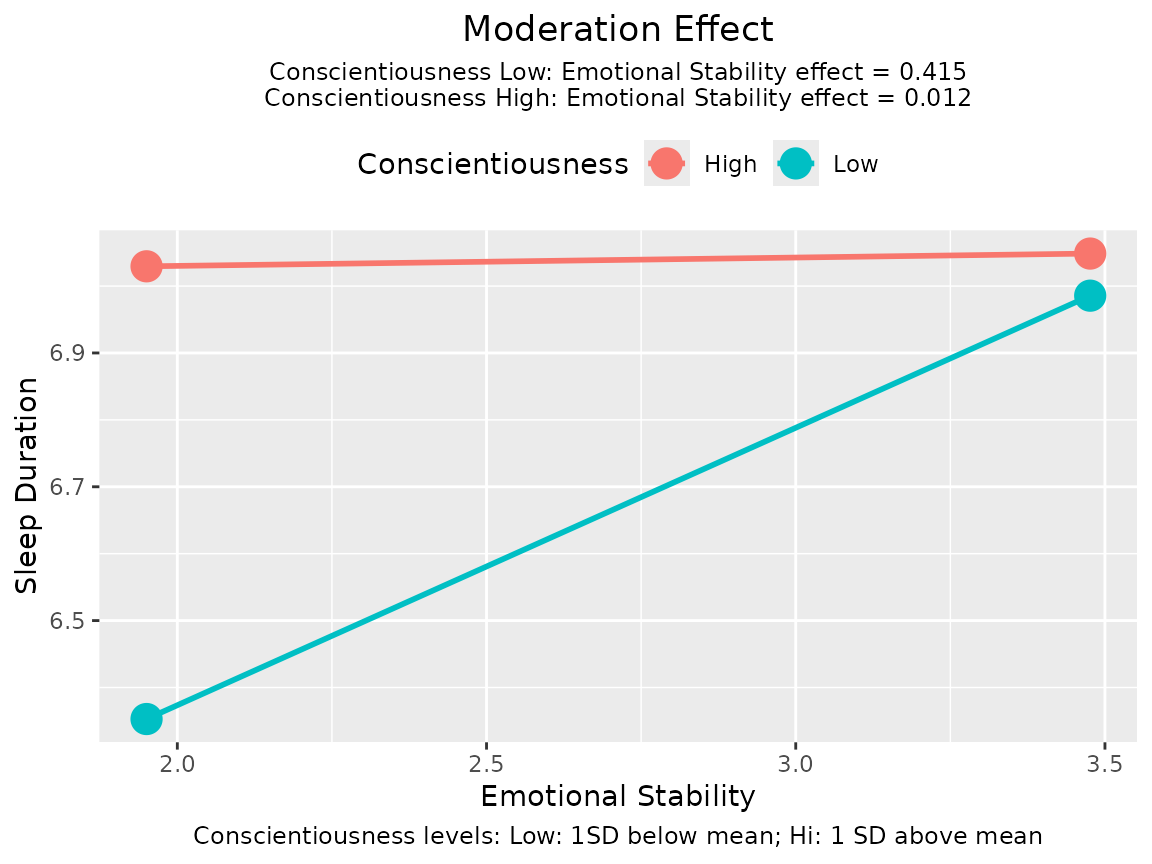
It can visualize a moderation effect by plotting the effect of the predictor (focal variable) on the outcome variable (dependent variable) for different levels of the moderator:
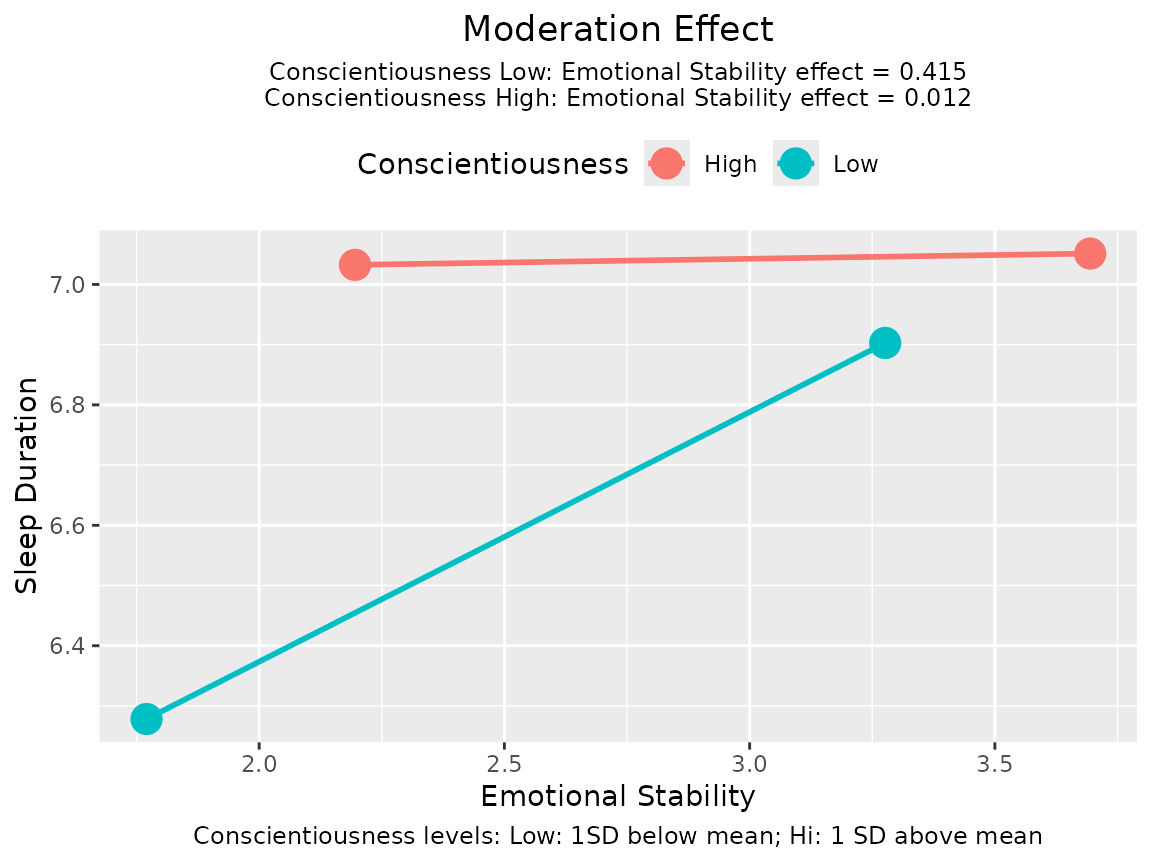
It can also plot a tumble graph (Bodner, 2016), in which the width of each line depends on the distribution of the predictor (focal variable) in each level of the moderator:
plotmod() is not designed to be a versatile tool. It is
designed to be a function “good-enough” for common scenarios. The output
of plotmod() is a ggplot object and so can be
further manipulated by functions from the ggplot2
package.
Major Arguments
Model, Predictor (x), and Moderator
(w)
output: The output oflm(),std_selected(), orstd_selected_boot(), with at least one interaction term.x: The predictor (focal variable). The variable in the horizontal axis.w: The moderator. The variable for which the conditional effects will be plotted.
These are the only required arguments. Just setting them can generate the graph:
library(stdmod)
data(sleep_emo_con)
lm_raw <- lm(sleep_duration ~ age + gender +
                              emotional_stability * conscientiousness,
             sleep_emo_con)
plotmod(lm_raw,
        x = "emotional_stability",
        w = "conscientiousness")
Levels of the Moderator
Numeric Moderators
If the moderator is a numeric variable, then two lines will be drawn, by default. One line for one standard deviation (SD) below the mean on the moderator (“Low”), and the other for one SD above the mean (“High”).
Users can also use percentiles to define “Low” and “High” by setting
w_method to "percentile". By default, 16th
percentile and 84th percentile are used, which correspond approximately
to one SD below and above mean, respectively, for a normal
distribution.
lm_raw <- lm(sleep_duration ~ age + gender +
                              emotional_stability * conscientiousness,
             sleep_emo_con)
plotmod(lm_raw,
        x = "emotional_stability",
        w = "conscientiousness",
        w_method = "percentile")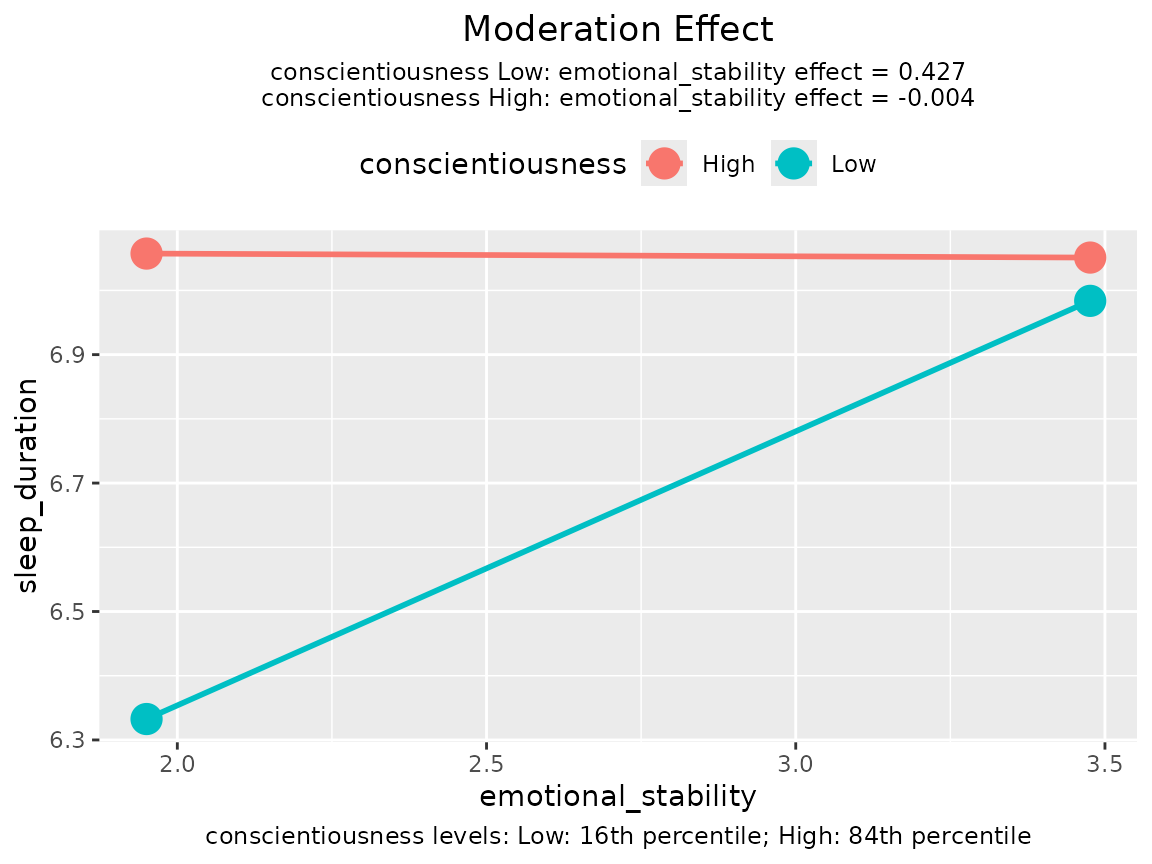
Categorical Moderators
If the moderator is a categorical variable (a string variable or a factor), then one line will be drawn for each category.
set.seed(61452)
sleep_emo_con$city <- sample(c("Alpha", "Beta", "Gamma"),
                             nrow(sleep_emo_con),
                             replace = TRUE)
lm_cat <- lm(sleep_duration ~ age + gender +
                              emotional_stability * city,
             sleep_emo_con)
plotmod(lm_cat,
        x = "emotional_stability",
        w = "city")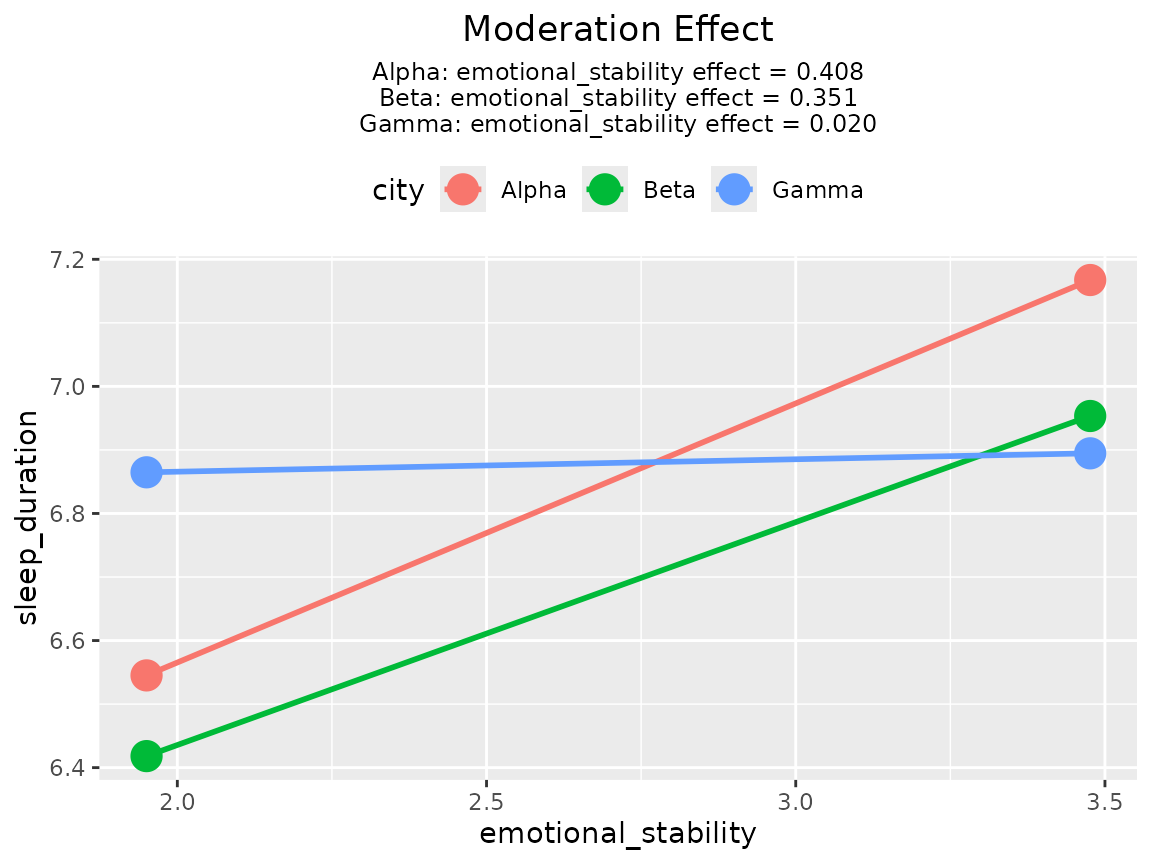
Tumble Graph
By default, each line starts from one SD below mean of the predictor to one SD above mean of the predictor. This assumes that variation of the predictor is the same for different levels of the moderator. However, this may not be the case when the predictor and the moderator are associated. Bodner (2016) proposed a type of graph called tumble graph that can show the association between the predictor and the moderator, if any.
The idea is simple. Instead of using the SD of the predictor in the
whole sample, the mean and SD of the predictor for the selected level of
the moderator is used. (See the technical notes below on how it is
implemented in plotmod().)
To plot a tumble graph, just set graph_type to
"tumble":
lm_raw <- lm(sleep_duration ~ age + gender +
                              emotional_stability * conscientiousness,
             sleep_emo_con)
plotmod(lm_raw,
        x = "emotional_stability",
        w = "conscientiousness",
        graph_type = "tumble")
The graph above shows that, the distribution of the predictor shifts to the left when the moderator is low.
Decoration and Annotation
Variable Labels
By default, the variable names are used in the graph. Users can
supply labels that will be used instead of variable names by setting
x_label, w_label, and y_label to
strings for the predictor, moderator, and outcome variable,
respectively.
lm_raw <- lm(sleep_duration ~ age + gender +
                              emotional_stability * conscientiousness,
             sleep_emo_con)
plotmod(lm_raw,
        x = "emotional_stability",
        w = "conscientiousness",
        x_label = "EMO",
        w_label = "CON",
        y_label = "SLEEP")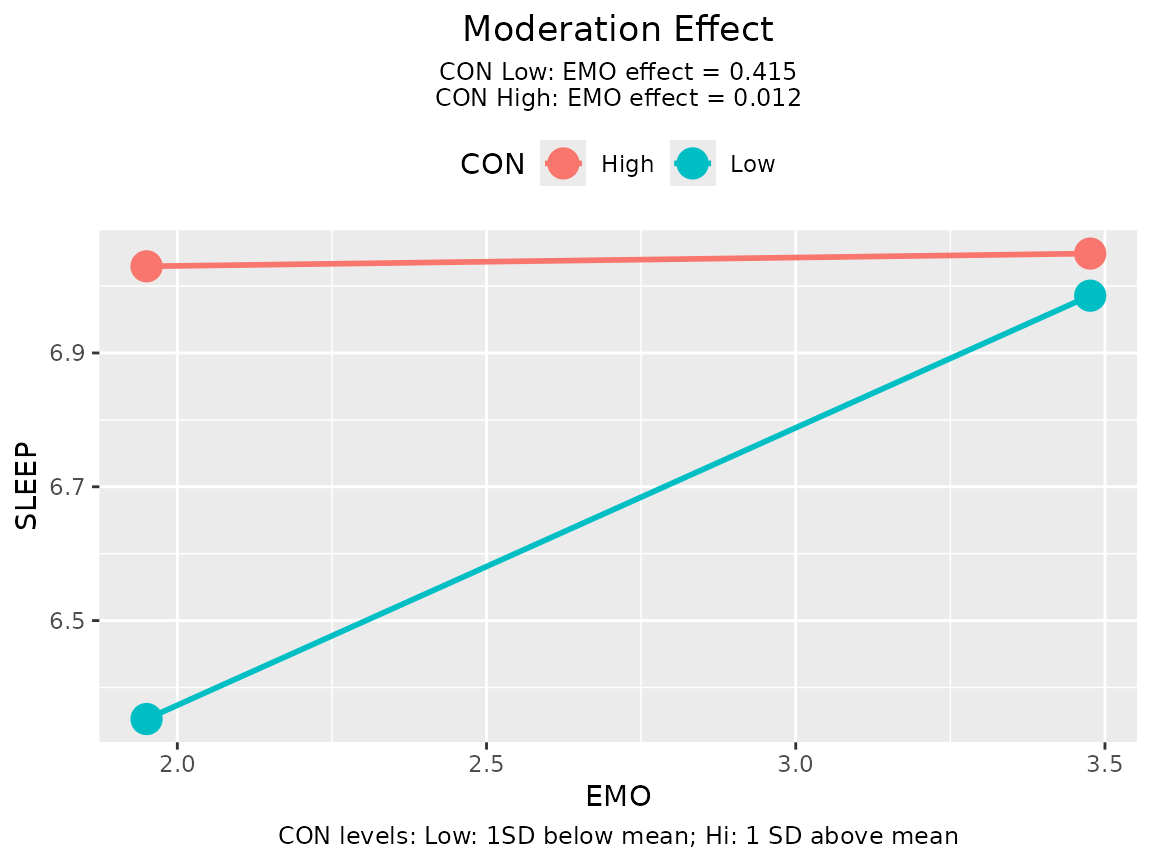
Title
The default title is “Moderation Effect”. This can be changed via the
argument title:
lm_raw <- lm(sleep_duration ~ age + gender +
                              emotional_stability * conscientiousness,
             sleep_emo_con)
plotmod(lm_raw,
        x = "emotional_stability",
        w = "conscientiousness",
        title = "EMO Effects For Low/High CON")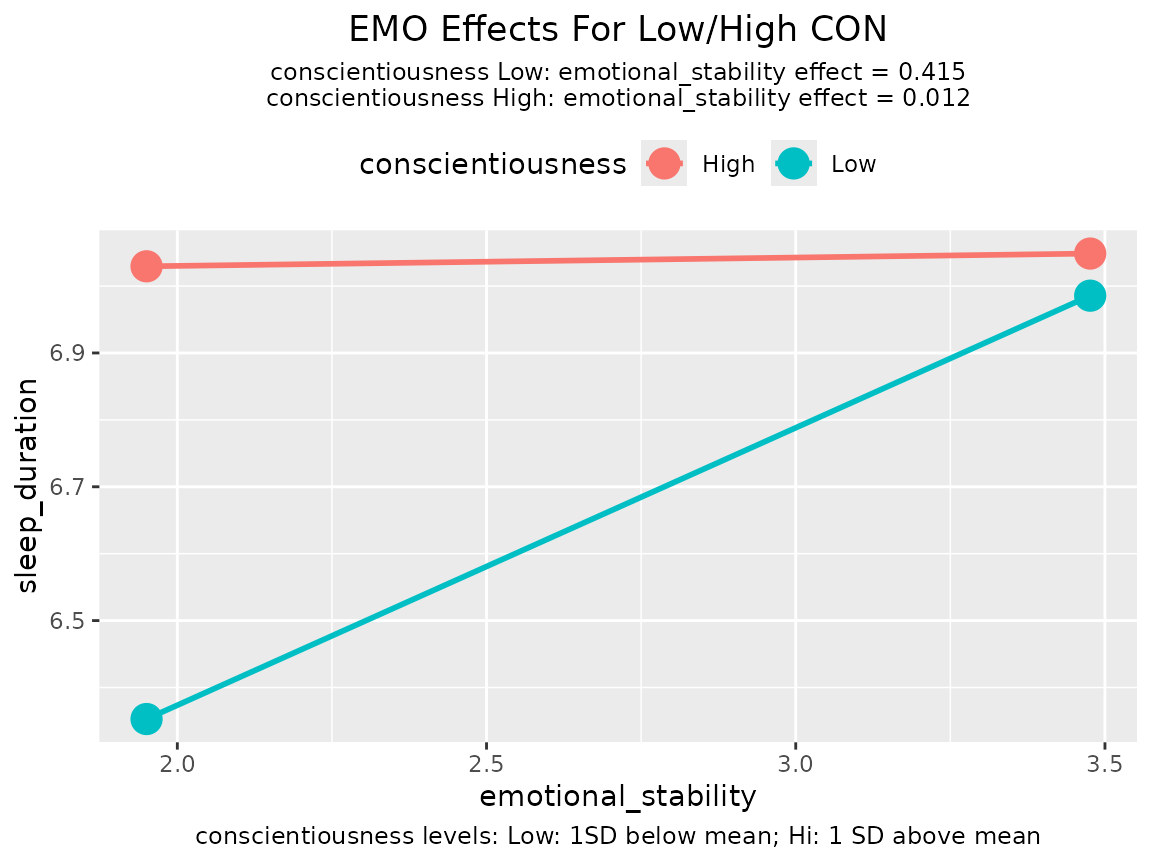
Some journals require submitted figures to have no title because they
will be described by figure captions, supplied separately. The title can
be disabled by setting no_title to TRUE.
Line Width and Point Size
plotmod() supports basic control of the lines. The width
of the lines can be set by line_width and the size on the
end-points can be set by point_size:
lm_raw <- lm(sleep_duration ~ age + gender +
                              emotional_stability * conscientiousness,
             sleep_emo_con)
plotmod(lm_raw,
        x = "emotional_stability",
        w = "conscientiousness",
        point_size = 8,
        line_width = 2)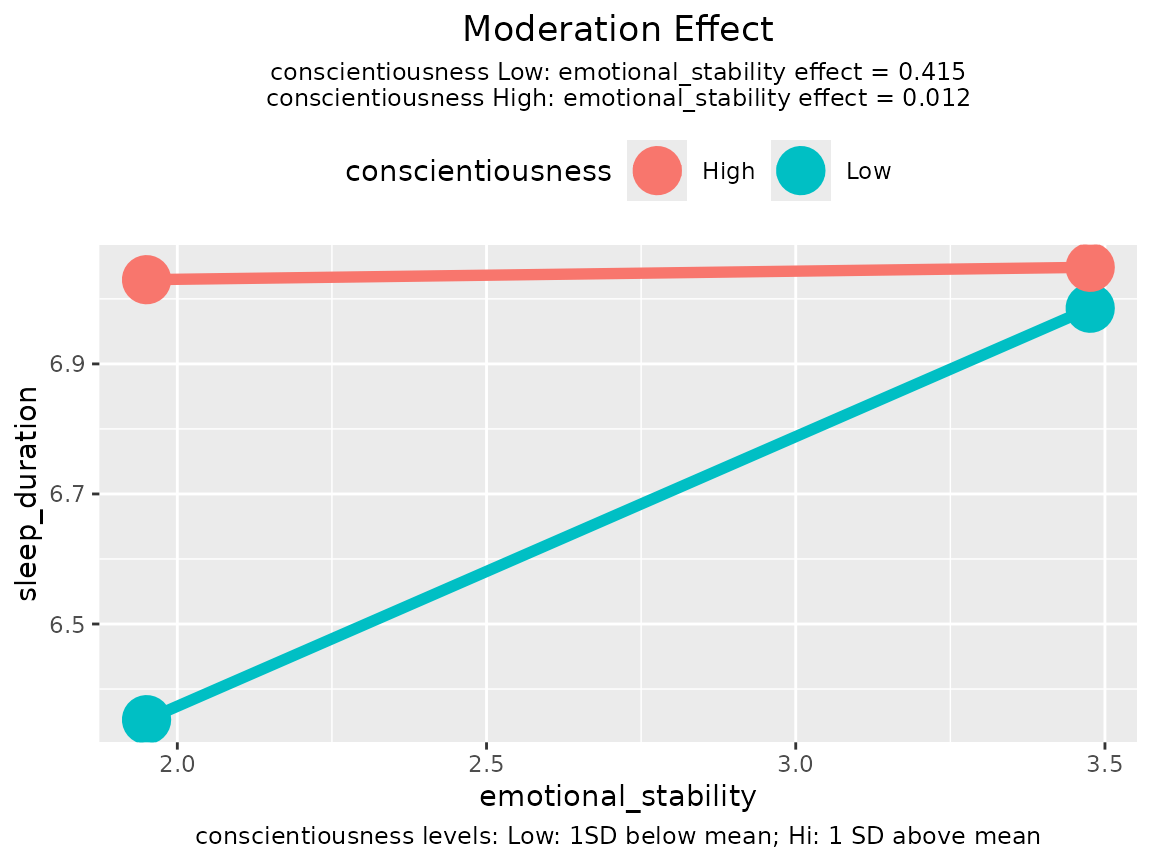
Information
Conditional Effects
By default, plotmod() prints the conditional effects of
the predictor as a subtitle. This can be disabled by adding a
ggplot2::theme() call to the output and set
plot.subtitle to element_blank(), which
removes the subtitle:
lm_raw <- lm(sleep_duration ~ age + gender +
                              emotional_stability * conscientiousness,
             sleep_emo_con)
p <- plotmod(lm_raw,
              x = "emotional_stability",
              w = "conscientiousness")
library(ggplot2)
p + theme(plot.subtitle = element_blank())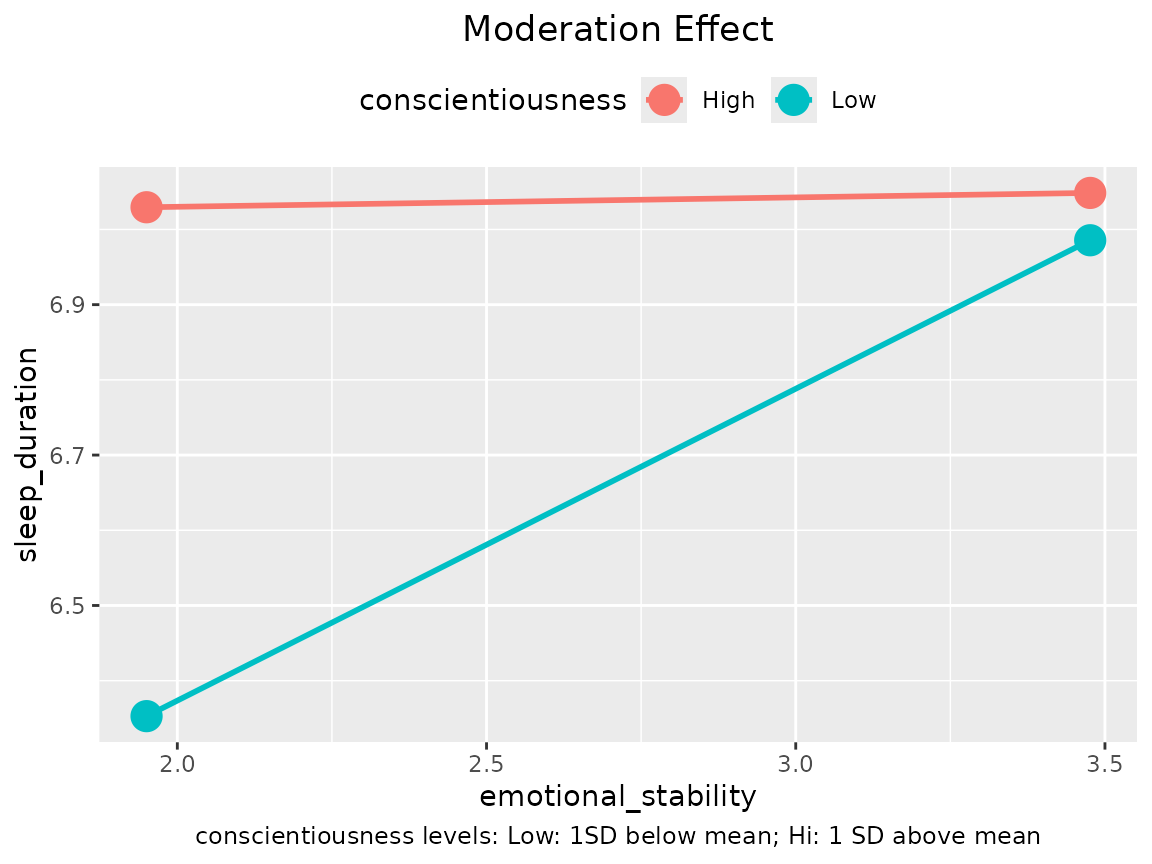
Definitions of the Levels of the Moderator
By default, the definitions of the levels of moderator (e.g., one SD
below mean for “Low” and one SD above mean for “High”) are printed as a
caption. This can also be disabled by adding a
ggplot2::theme() call and set plot.caption to
element_blank():
lm_raw <- lm(sleep_duration ~ age + gender +
                              emotional_stability * conscientiousness,
             sleep_emo_con)
p <- plotmod(lm_raw,
             x = "emotional_stability",
             w = "conscientiousness")
p + theme(plot.caption = element_blank())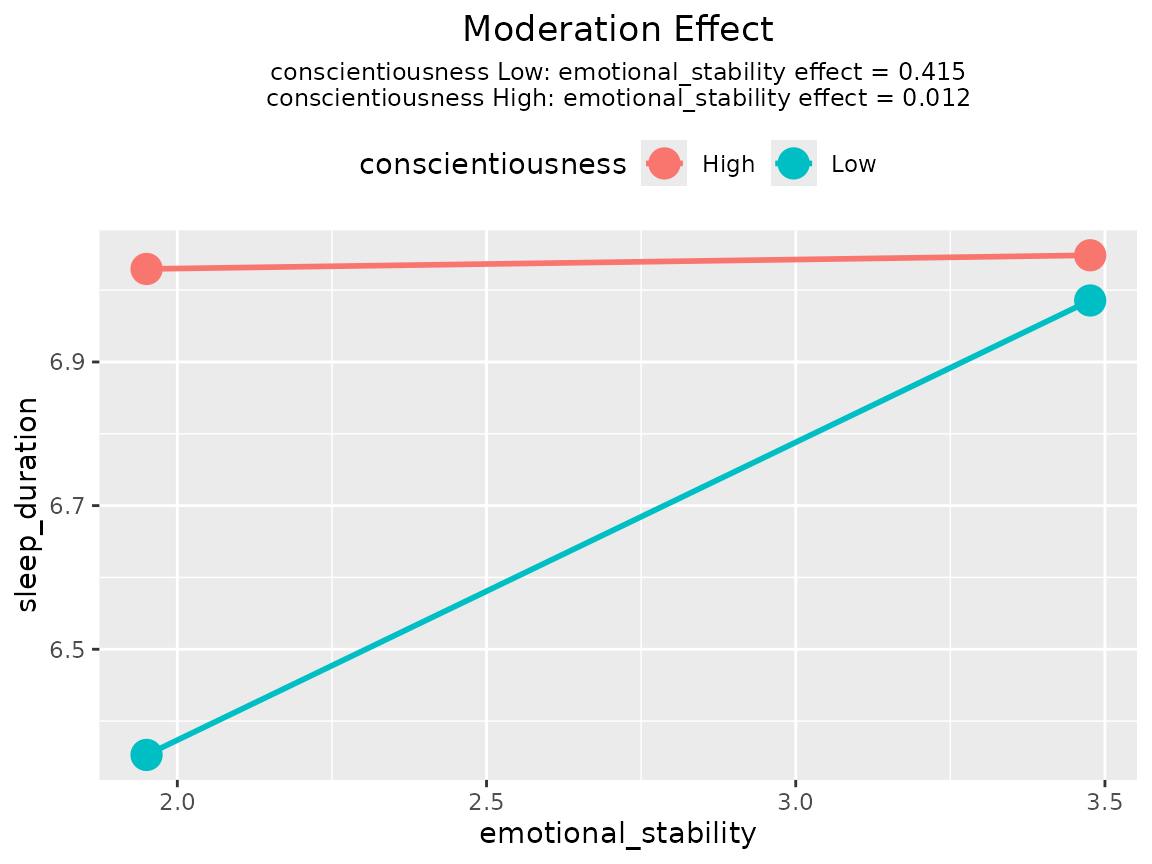
Any Variables Standardized?
If the output is generated by std_selected() or
std_selected_boot(), plotmod() will try to
detect if a variable is standardized or not, and report this in the
graph:
lm_raw <- lm(sleep_duration ~ age + gender +
                              emotional_stability * conscientiousness,
             sleep_emo_con)
lm_std <- std_selected(lm_raw,
                       to_standardize = ~ emotional_stability + conscientiousness)
# Before Version 0.2.6.3 of stdmod, to_center and to_scale need to be used:
# lm_std <- std_selected(lm_raw,
#                        to_center = ~ emotional_stability + conscientiousness,
#                        to_scale = ~ emotional_stability + conscientiousness)
The output of std_selected() can then be passed to
plotmod():
plotmod(lm_std,
        x = "emotional_stability",
        w = "conscientiousness")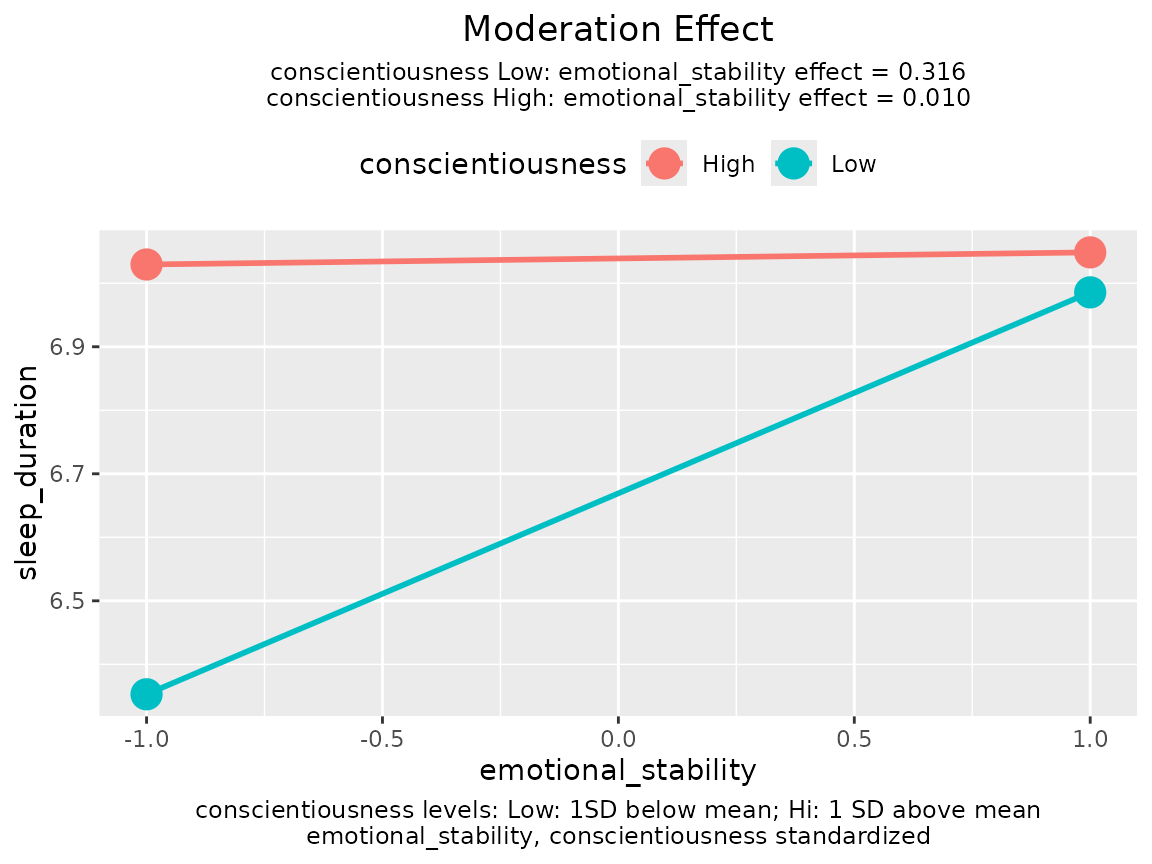
If the predictor, moderator, and outcome variable are all standardized, then the moderation effect is standardized moderation effect (Cheung, Cheung, Lau, Hui, & Vong, 2022), and the conditional effect printed on the graph are the standardized effects of the predictor for different levels of the moderator.
If which variables are standardized will be reported in the main text
and so the figure does not need to report this, set
note_standardized to FALSE.
Tweak the Graph
The output of plotmod() is a ggplot object.
Therefore, it can be manipulated by functions that modify a
ggplot object. For example, users can change the colors of
the lines and the theme:
lm_raw <- lm(sleep_duration ~ age + gender +
                              emotional_stability * conscientiousness,
             sleep_emo_con)
p <- plotmod(lm_std,
              x = "emotional_stability",
              w = "conscientiousness")
p + scale_color_manual(values = c("blue", "red")) +
    theme_classic()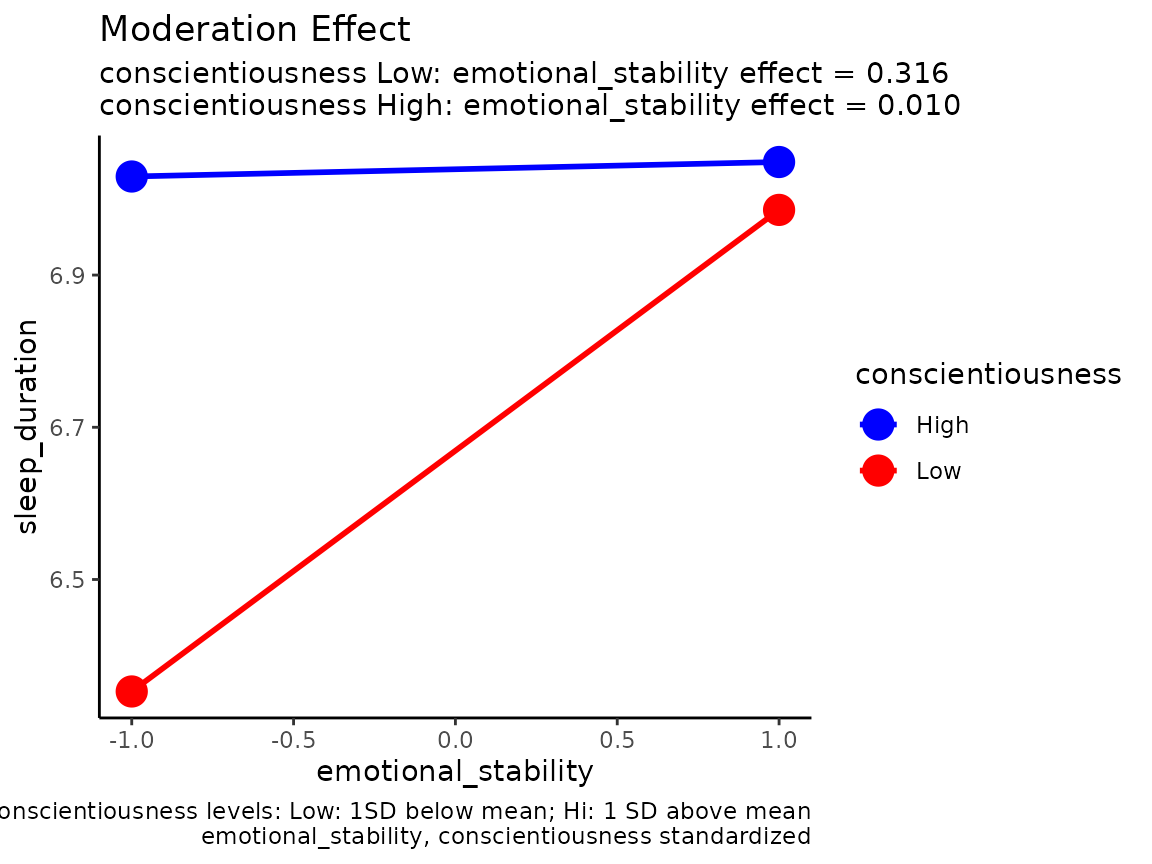
Technical Notes for Tumble Graph
Bodner (2016) proposed regressing the predictor on the moderator.
plotmod() uses a nonparametric approach.
If the moderator is numerical, for a level of moderator, say, one SD below mean, a certain percentage of cases (about 16% of cases above and below this value of the moderator) is used to compute the mean and SD of the predictor, which will be used to determine the end-points of the line segment for this level.
If the moderator is categorical, then the mean and SD of all cases in each group will be used to the determine the end-points of a line segment.
Further Information
Please refer to the help page of plotmod() for other
options available.
Reference
Bodner, T. E. (2016). Tumble graphs: Avoiding misleading end point extrapolation when graphing interactions from a moderated multiple regression analysis. Journal of Educational and Behavioral Statistics, 41(6), 593-604.
Cheung, S. F., Cheung, S.-H., Lau, E. Y. Y., Hui, C. H., & Vong, W. N. (2022) Improving an old way to measure moderation effect in standardized units. Health Psychology, 41(7), 502-505. https://doi.org/10.1037/hea0001188.