Adjust Edge Label Positions to Avoid Overlapping Labels
Source:R/safe_edge_label_positions.R
safe_edge_label_position.RdMove the edge labels away from path intersections.
Usage
safe_edge_label_position(
  object,
  layout = NULL,
  default_pos = 0.5,
  tolerance = 0.05,
  update_plot = TRUE
)
Arguments
- object
It can be the output of
lavaan::sem()orlavaan::lavaan(), or alavaan-class object. The model must have abetamatrix of the structural path. It can also be aqgraphobject generated bysemPlot::semPaths(). It can also be a list of qgraph::qgraph objects, probably though not necessarily from a multigroup model. If it is a list of qgraph::qgraph objects andupdate_plotisTRUE, then the function will be applied to all the objects.- layout
A layout matrix. Required if
objectis alavaan-class object. Ignored ifobjectis aqgraphobject.- default_pos
Used if
objectis alavaan-class object. The default position of an edge label. If this position is "safe" (not on the intersection between paths), it will be used. Ignored ifobjectis aqgraphobject.- tolerance
If the distance between a position and an intersection is greater than this distance, then a position is considered safe and will not be adjusted.
- update_plot
Logical. Used on if
objectis aqgraphobject. IfTRUE, the function returns a modifiedqgraphobject. IfFALSE, the function returns a named vector of the new positions.
Value
If object is a lavaan-class
object, it returns
a named numeric vector of edge
positions to be used by
set_edge_label_position().
If object is a qgraph object
and update_plot is TRUE, it
returns a qgraph object with the
adjusted edge label positions.
Otherwise, it returns a named vector
of the position to be adjusted, as
for a lavaan-class object.
If object is a list of
qgraph::qgraph objects and
update_plot is TRUE, then it returns
a
list of processed qgraph::qgraph objects.
Details
This function identify all intersection points between two paths in a model, and set the position of an edge label to the mid-point of a line segment between an intersection point and the another intersection point or the origin/destination of a path.
This function is intended for having
a "likely" readable graph with as
little user-intervention as possible.
If precise control of the edge label
positions is desired, use
set_edge_label_position().
See also
set_edge_label_position()
on setting the positions of edge
labels.
Examples
library(lavaan)
library(semPlot)
# Create a dummy dataset
mod_pa <-
"
m11 ~ c1 + x1
m12 ~ c2 + m11 + m21
m21 ~ c1 + x1
m22 ~ c1 + m21 + m11
y ~ m12 + m22 + x1
"
fit <- lavaan::sem(
mod_pa,
do.fit = FALSE
)
dat <- simulateData(
parameterTable(fit),
sample.nobs = 500,
seed = 1234
)
fit <- lavaan::sem(
mod_pa,
dat
)
# Set the layout
m <- auto_layout_mediation(
fit,
exclude = c("c1", "c2", "c3")
)
pos_new <- safe_edge_label_position(
fit,
layout = m
)
pos_new
#> y~x1 m12~m21 m22~m11
#> 0.275 0.275 0.275
pm <- semPlotModel(fit) |> drop_nodes(c("c1", "c2"))
p <- semPaths(
pm,
whatLabels = "est",
layout = m,
DoNotPlot = TRUE
)
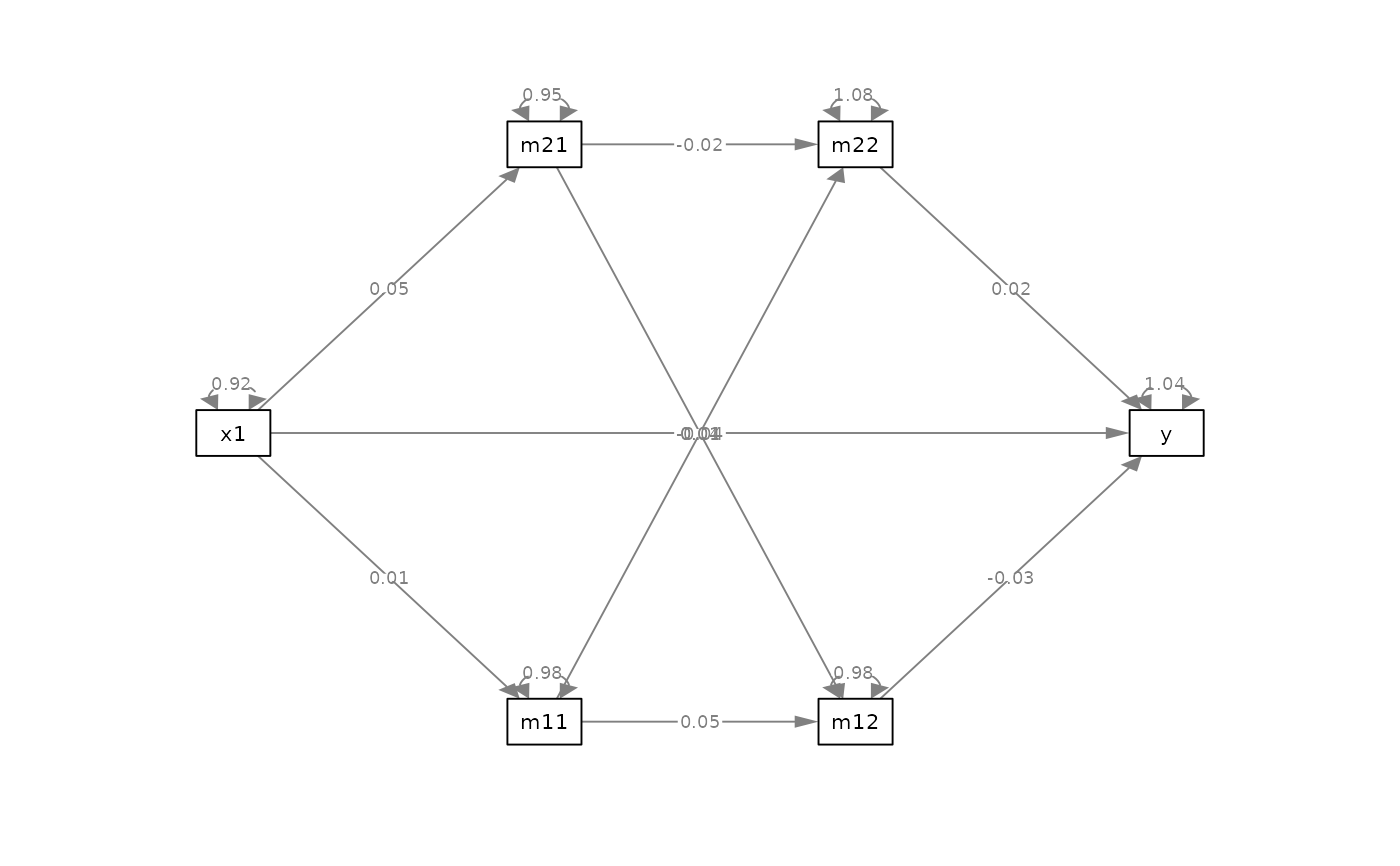
# Three labels overlap with each other
plot(p)
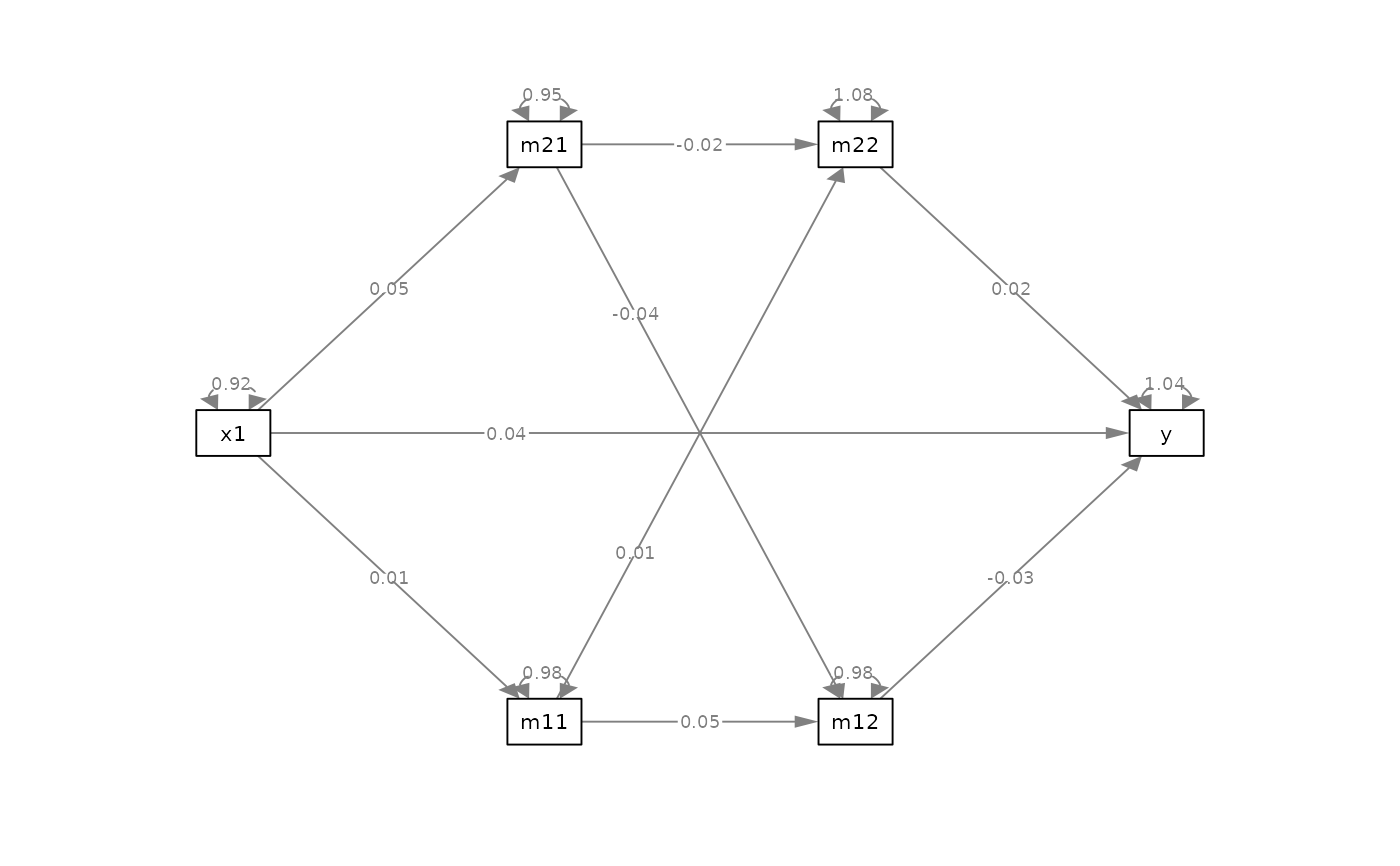
 # Update the plot
p_safe <- p |> safe_edge_label_position()
# Three labels do not overlap in this plot
plot(p_safe)
# Update the plot
p_safe <- p |> safe_edge_label_position()
# Three labels do not overlap in this plot
plot(p_safe)
 # Set the position manually
p_safe2 <- p |>
set_edge_label_position(pos_new)
plot(p_safe2)
# Set the position manually
p_safe2 <- p |>
set_edge_label_position(pos_new)
plot(p_safe2)