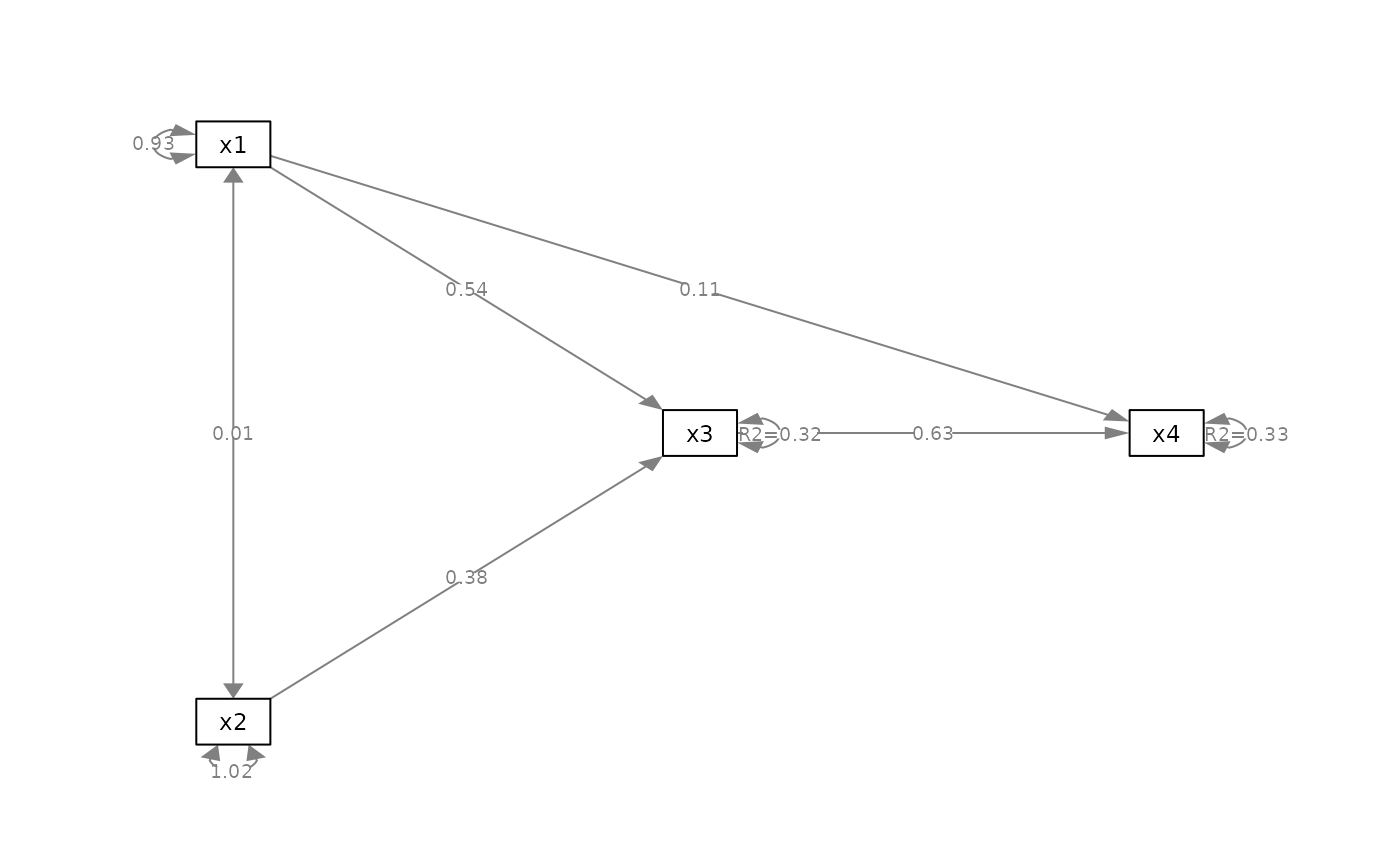
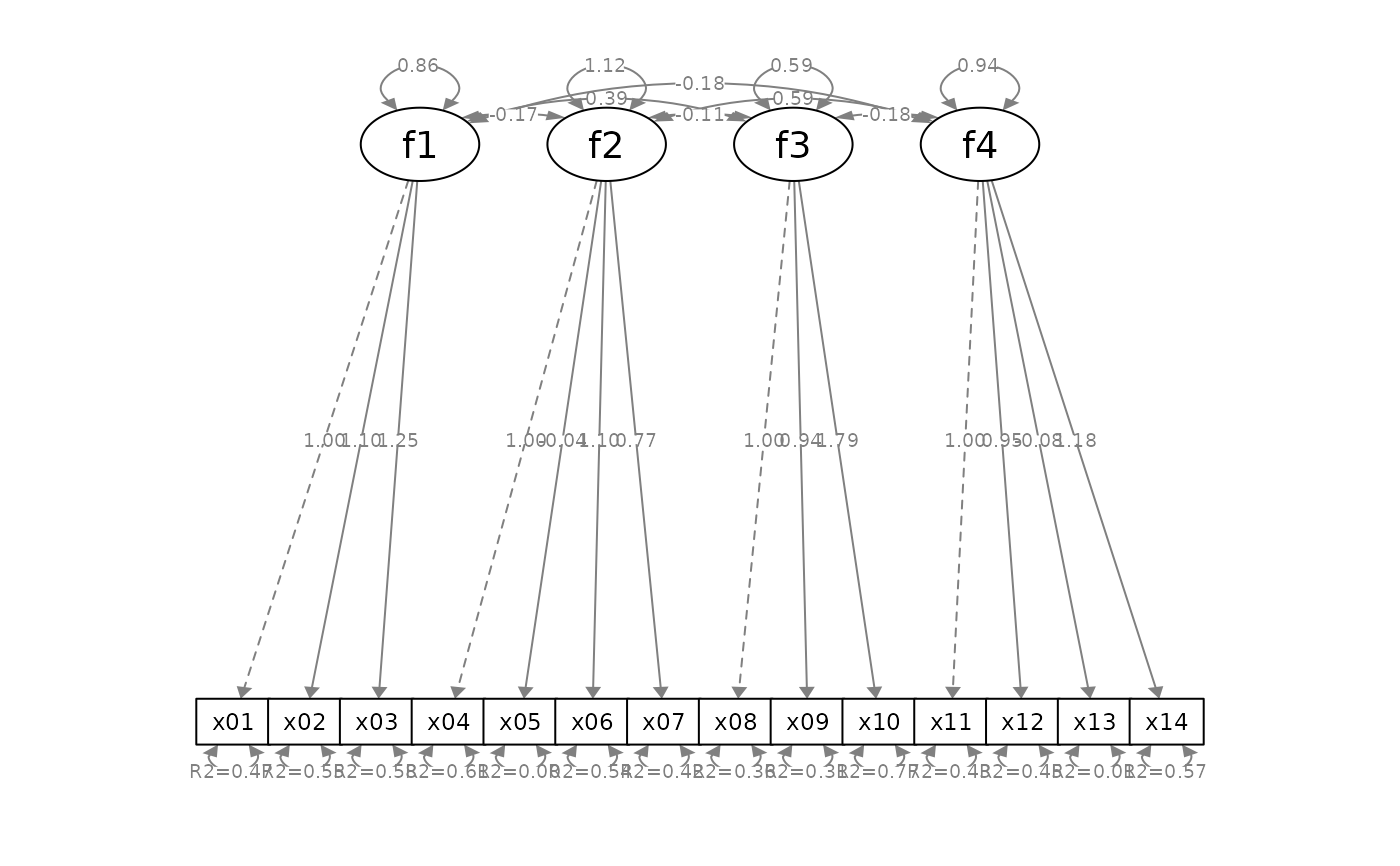
Replace the residual variances of exogenous variables by their R-squares in a qgraph::qgraph object.
Arguments
- semPaths_plot
A qgraph object generated by
semPaths, or a similar qgraph object modified by other semptools functions.- object
The object used by semPaths to generate the plot. Use the same argument name used in
semPathsto make the meaning of this argument obvious. Currently only object of classlavaanis supported.- digits
Integer indicating number of decimal places for the R-squares. Default is 2L.
- rsq_string
The string before the R-squares. Default is
"R2=".- ests
A data.frame from the
parameterEstimatesfunction, or from other function with these columns:?lhs,op,rhs, andest. The rows withopequal tor2are used to find the R-squares. Only used whenobjectis not specified.
Value
If the input is a qgraph::qgraph object, the function returns a qgraph based on the original one, with R-squares added. If the input is a list of qgraph objects, the function returns a list of the same length.
Details
Modify a qgraph::qgraph object generated by
semPaths by setting the labels
of the residuals of endogenous variables to their
R-squares.
Require either the original object used in the semPaths call, or a data frame with the R-square for each endogenous variable.
Currently supports only plots based on lavaan
output.
Examples
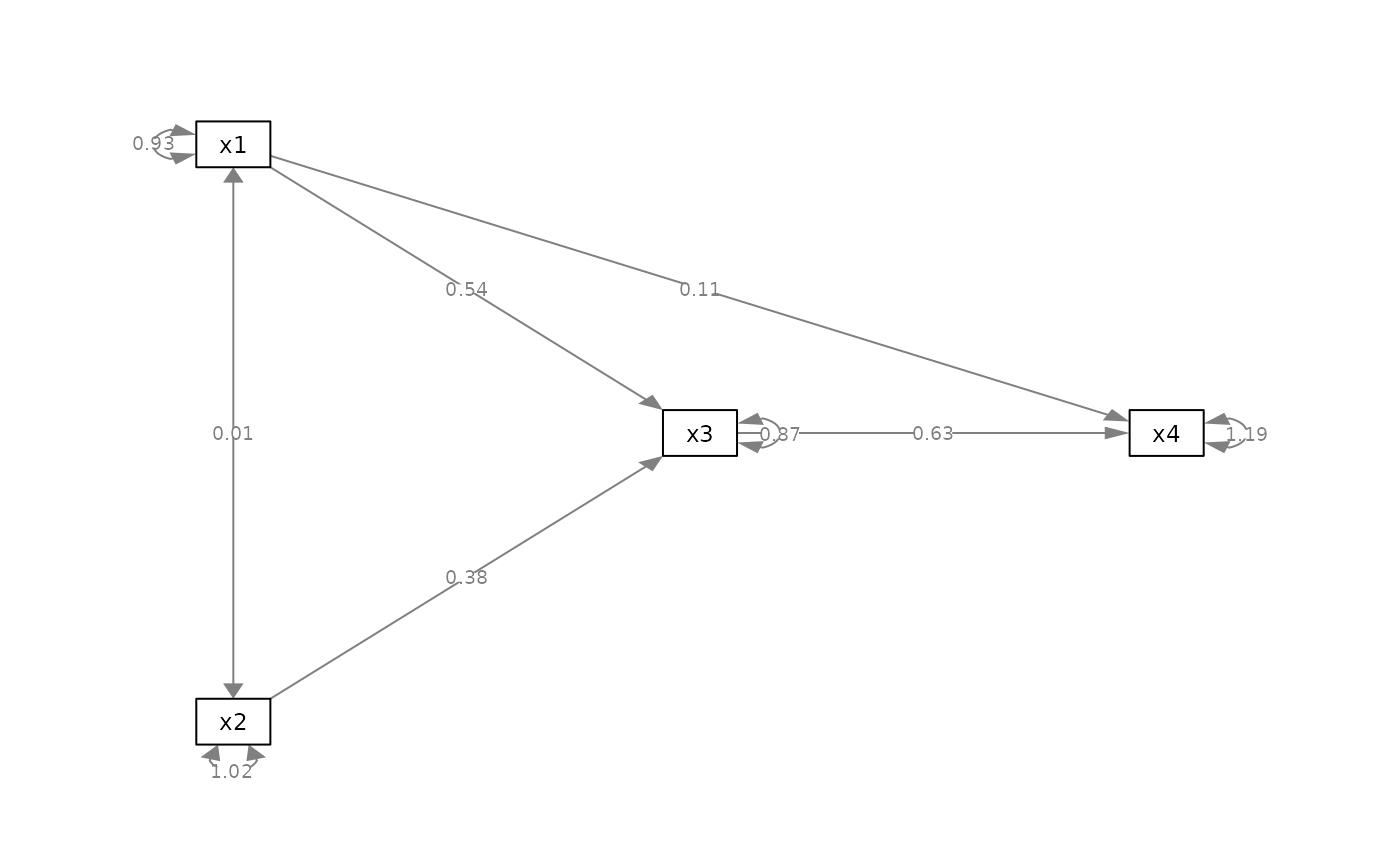
mod_pa <-
'x1 ~~ x2
x3 ~ x1 + x2
x4 ~ x1 + x3
'
fit_pa <- lavaan::sem(mod_pa, pa_example)
lavaan::parameterEstimates(fit_pa)[ , c("lhs", "op", "rhs",
"est", "pvalue", "se")]
#> lhs op rhs est pvalue se
#> 1 x1 ~~ x2 0.005 0.957 0.097
#> 2 x3 ~ x1 0.537 0.000 0.097
#> 3 x3 ~ x2 0.376 0.000 0.093
#> 4 x4 ~ x1 0.111 0.382 0.127
#> 5 x4 ~ x3 0.629 0.000 0.108
#> 6 x3 ~~ x3 0.874 0.000 0.124
#> 7 x4 ~~ x4 1.194 0.000 0.169
#> 8 x1 ~~ x1 0.933 0.000 0.132
#> 9 x2 ~~ x2 1.017 0.000 0.144
m <- matrix(c("x1", NA, NA,
NA, "x3", "x4",
"x2", NA, NA), byrow = TRUE, 3, 3)
p_pa <- semPlot::semPaths(fit_pa, whatLabels = "est",
style = "ram",
nCharNodes = 0, nCharEdges = 0,
layout = m)
 p_pa2 <- add_rsq(p_pa, fit_pa)
plot(p_pa2)
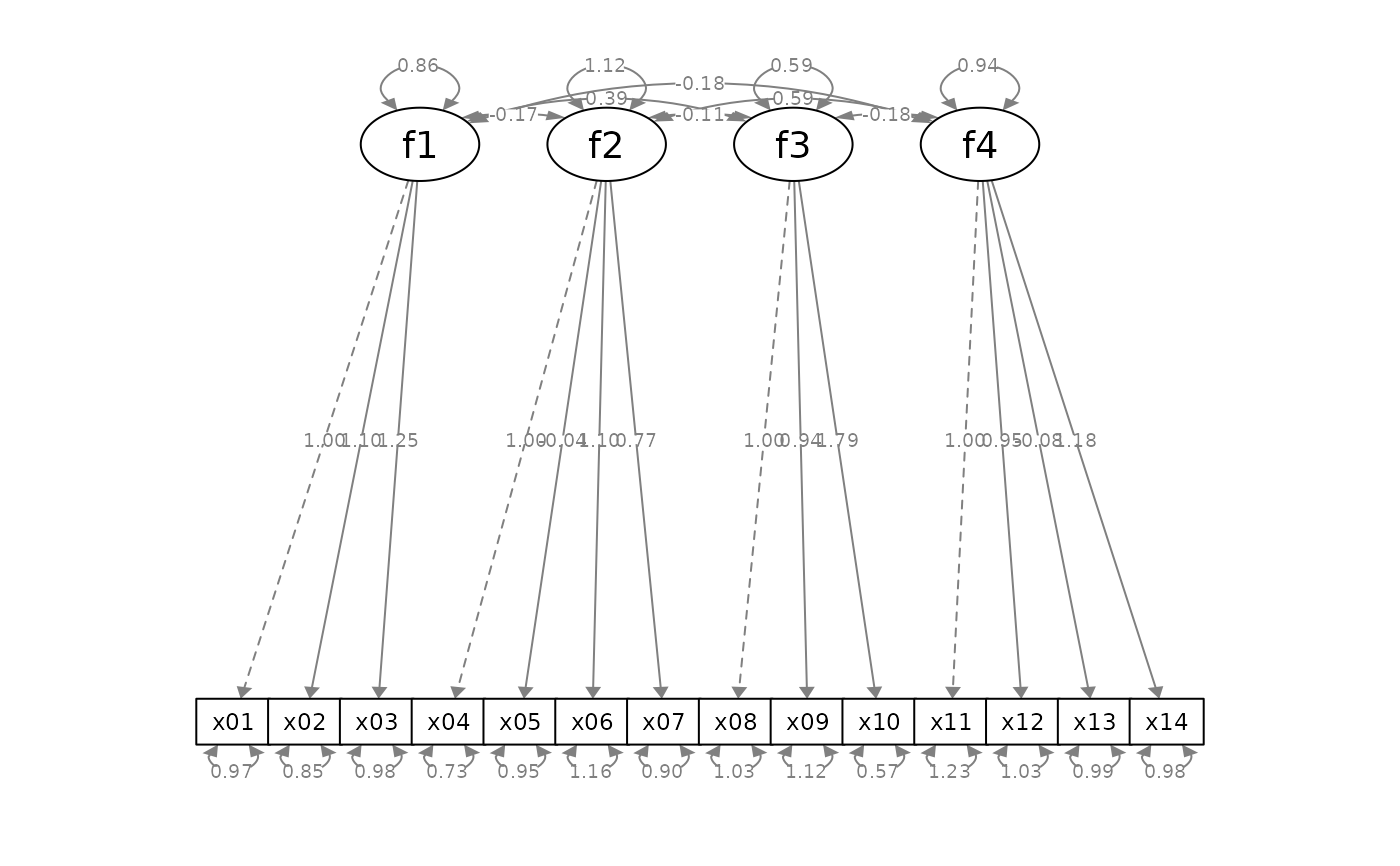
 mod_cfa <-
'f1 =~ x01 + x02 + x03
f2 =~ x04 + x05 + x06 + x07
f3 =~ x08 + x09 + x10
f4 =~ x11 + x12 + x13 + x14
'
fit_cfa <- lavaan::sem(mod_cfa, cfa_example)
lavaan::parameterEstimates(fit_cfa)[ , c("lhs", "op", "rhs",
"est", "pvalue", "se")]
#> lhs op rhs est pvalue se
#> 1 f1 =~ x01 1.000 NA 0.000
#> 2 f1 =~ x02 1.097 0.000 0.137
#> 3 f1 =~ x03 1.247 0.000 0.154
#> 4 f2 =~ x04 1.000 NA 0.000
#> 5 f2 =~ x05 -0.040 0.587 0.073
#> 6 f2 =~ x06 1.098 0.000 0.132
#> 7 f2 =~ x07 0.771 0.000 0.099
#> 8 f3 =~ x08 1.000 NA 0.000
#> 9 f3 =~ x09 0.937 0.000 0.148
#> 10 f3 =~ x10 1.785 0.000 0.262
#> 11 f4 =~ x11 1.000 NA 0.000
#> 12 f4 =~ x12 0.949 0.000 0.134
#> 13 f4 =~ x13 -0.077 0.356 0.083
#> 14 f4 =~ x14 1.184 0.000 0.161
#> 15 x01 ~~ x01 0.969 0.000 0.129
#> 16 x02 ~~ x02 0.853 0.000 0.130
#> 17 x03 ~~ x03 0.976 0.000 0.159
#> 18 x04 ~~ x04 0.725 0.000 0.130
#> 19 x05 ~~ x05 0.954 0.000 0.095
#> 20 x06 ~~ x06 1.161 0.000 0.176
#> 21 x07 ~~ x07 0.903 0.000 0.114
#> 22 x08 ~~ x08 1.026 0.000 0.125
#> 23 x09 ~~ x09 1.119 0.000 0.129
#> 24 x10 ~~ x10 0.566 0.009 0.218
#> 25 x11 ~~ x11 1.231 0.000 0.163
#> 26 x12 ~~ x12 1.032 0.000 0.141
#> 27 x13 ~~ x13 0.990 0.000 0.099
#> 28 x14 ~~ x14 0.985 0.000 0.172
#> 29 f1 ~~ f1 0.855 0.000 0.176
#> 30 f2 ~~ f2 1.119 0.000 0.201
#> 31 f3 ~~ f3 0.585 0.000 0.143
#> 32 f4 ~~ f4 0.943 0.000 0.209
#> 33 f1 ~~ f2 -0.173 0.059 0.092
#> 34 f1 ~~ f3 0.387 0.000 0.089
#> 35 f1 ~~ f4 -0.178 0.041 0.087
#> 36 f2 ~~ f3 -0.112 0.132 0.074
#> 37 f2 ~~ f4 0.593 0.000 0.122
#> 38 f3 ~~ f4 -0.181 0.014 0.074
p_cfa <- semPlot::semPaths(fit_cfa, whatLabels = "est",
style = "ram",
nCharNodes = 0, nCharEdges = 0)
 # Place standard errors on a new line
p_cfa2 <- add_rsq(p_cfa, fit_cfa)
plot(p_cfa2)
 mod_sem <-
'f1 =~ x01 + x02 + x03
f2 =~ x04 + x05 + x06 + x07
f3 =~ x08 + x09 + x10
f4 =~ x11 + x12 + x13 + x14
f3 ~ f1 + f2
f4 ~ f1 + f3
'
# Can be used with mark_se() and mark_sig()
fit_sem <- lavaan::sem(mod_sem, sem_example)
lavaan::parameterEstimates(fit_sem)[ , c("lhs", "op", "rhs",
"est", "pvalue", "se")]
#> lhs op rhs est pvalue se
#> 1 f1 =~ x01 1.000 NA 0.000
#> 2 f1 =~ x02 1.124 0.000 0.166
#> 3 f1 =~ x03 1.310 0.000 0.191
#> 4 f2 =~ x04 1.000 NA 0.000
#> 5 f2 =~ x05 0.079 0.205 0.062
#> 6 f2 =~ x06 1.120 0.000 0.121
#> 7 f2 =~ x07 0.736 0.000 0.093
#> 8 f3 =~ x08 1.000 NA 0.000
#> 9 f3 =~ x09 0.819 0.000 0.084
#> 10 f3 =~ x10 1.230 0.000 0.112
#> 11 f4 =~ x11 1.000 NA 0.000
#> 12 f4 =~ x12 0.773 0.000 0.068
#> 13 f4 =~ x13 0.064 0.160 0.046
#> 14 f4 =~ x14 0.928 0.000 0.073
#> 15 f3 ~ f1 0.612 0.000 0.131
#> 16 f3 ~ f2 0.584 0.000 0.093
#> 17 f4 ~ f1 -0.542 0.001 0.170
#> 18 f4 ~ f3 0.980 0.000 0.127
#> 19 x01 ~~ x01 1.055 0.000 0.138
#> 20 x02 ~~ x02 1.015 0.000 0.149
#> 21 x03 ~~ x03 1.028 0.000 0.178
#> 22 x04 ~~ x04 0.933 0.000 0.144
#> 23 x05 ~~ x05 0.795 0.000 0.080
#> 24 x06 ~~ x06 0.771 0.000 0.156
#> 25 x07 ~~ x07 1.071 0.000 0.126
#> 26 x08 ~~ x08 0.976 0.000 0.134
#> 27 x09 ~~ x09 0.937 0.000 0.115
#> 28 x10 ~~ x10 1.164 0.000 0.177
#> 29 x11 ~~ x11 1.008 0.000 0.161
#> 30 x12 ~~ x12 1.033 0.000 0.131
#> 31 x13 ~~ x13 0.846 0.000 0.085
#> 32 x14 ~~ x14 0.807 0.000 0.135
#> 33 f1 ~~ f1 0.714 0.000 0.168
#> 34 f2 ~~ f2 1.277 0.000 0.229
#> 35 f3 ~~ f3 0.759 0.000 0.151
#> 36 f4 ~~ f4 1.188 0.000 0.221
#> 37 f1 ~~ f2 0.016 0.856 0.088
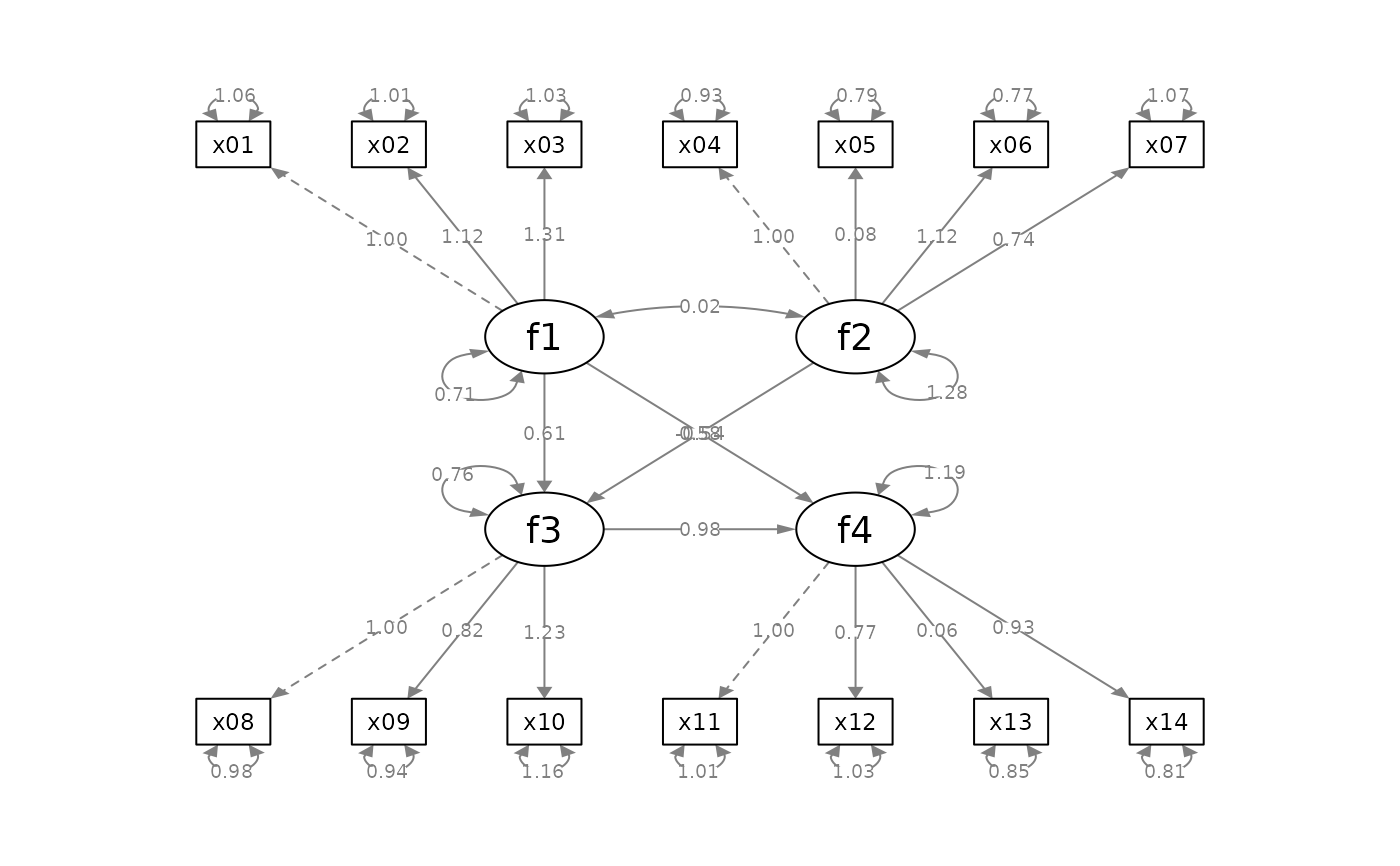
p_sem <- semPlot::semPaths(fit_sem, whatLabels = "est",
style = "ram",
nCharNodes = 0, nCharEdges = 0)
 # Mark significance, and then add standard errors
p_sem2 <- mark_sig(p_sem, fit_sem)
p_sem3 <- mark_se(p_sem2, fit_sem, sep = "\n")
p_sem4 <- add_rsq(p_sem3, fit_sem)
plot(p_sem4)

