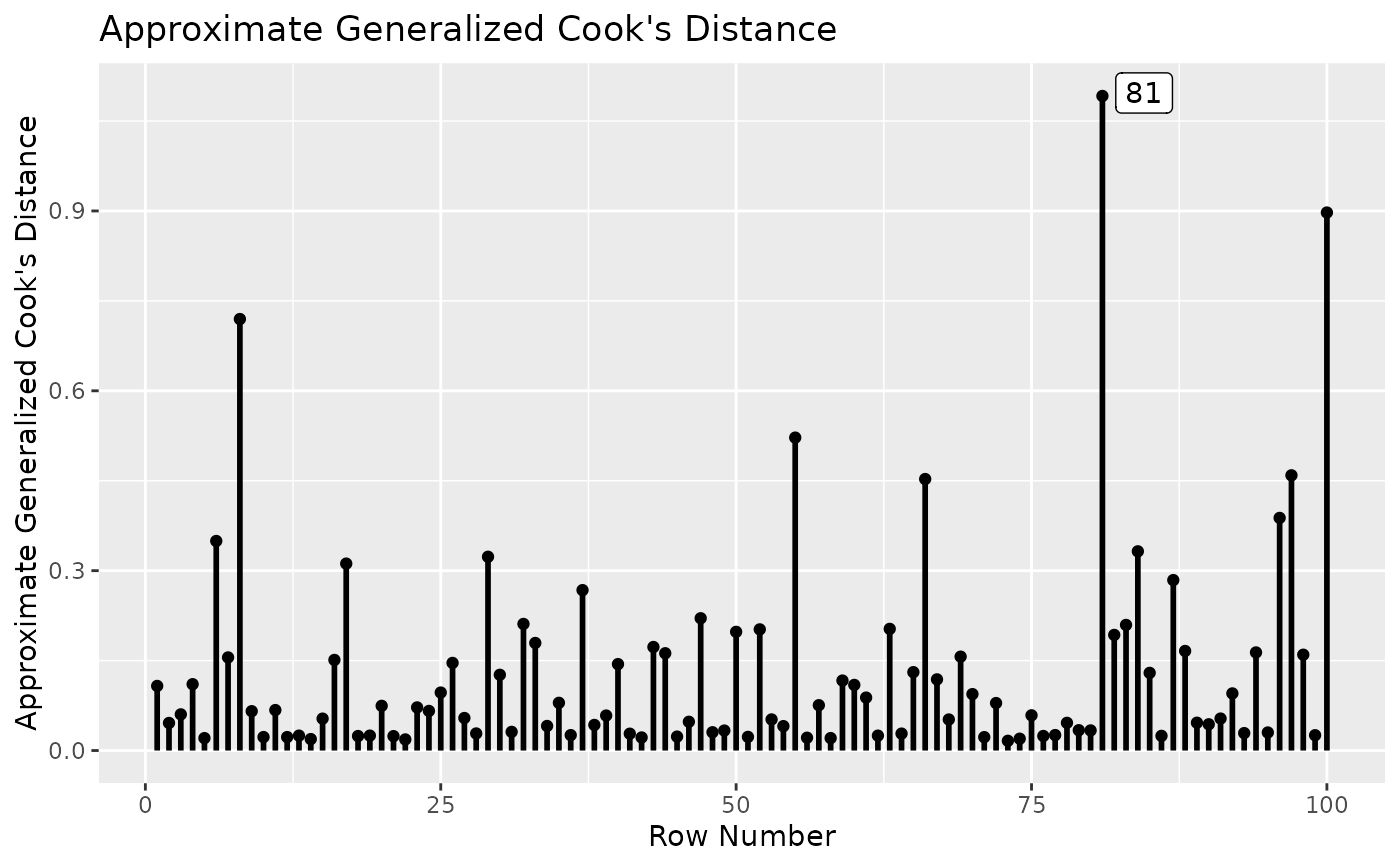
A six-variable dataset with 100 cases, with one influential case.
Format
A data frame with 100 rows and 7 variables:
- case_id
Case ID. Character.
- x1
Indicator. Numeric.
- x2
Indicator. Numeric.
- x3
Indicator. Numeric.
- x4
Indicator. Numeric.
- x5
Indicator. Numeric.
- x6
Indicator. Numeric.
Examples
library(lavaan)
data(cfa_dat2)
mod <-
"
f1 =~  x1 + x2 + x3
f2 =~  x4 + x5 + x6
"
fit <- cfa(mod, cfa_dat2)
summary(fit)
#> lavaan 0.6-21 ended normally after 36 iterations
#>
#>   Estimator                                         ML
#>   Optimization method                           NLMINB
#>   Number of model parameters                        13
#>
#>   Number of observations                           100
#>
#> Model Test User Model:
#>
#>   Test statistic                                16.218
#>   Degrees of freedom                                 8
#>   P-value (Chi-square)                           0.039
#>
#> Parameter Estimates:
#>
#>   Standard errors                             Standard
#>   Information                                 Expected
#>   Information saturated (h1) model          Structured
#>
#> Latent Variables:
#>                    Estimate  Std.Err  z-value  P(>|z|)
#>   f1 =~
#>     x1                1.000
#>     x2                2.875    1.336    2.152    0.031
#>     x3                1.827    0.847    2.158    0.031
#>   f2 =~
#>     x4                1.000
#>     x5                2.434    0.672    3.625    0.000
#>     x6                1.940    0.523    3.709    0.000
#>
#> Covariances:
#>                    Estimate  Std.Err  z-value  P(>|z|)
#>   f1 ~~
#>     f2                0.063    0.035    1.797    0.072
#>
#> Variances:
#>                    Estimate  Std.Err  z-value  P(>|z|)
#>    .x1                0.919    0.134    6.840    0.000
#>    .x2                0.383    0.162    2.366    0.018
#>    .x3                0.542    0.100    5.438    0.000
#>    .x4                0.767    0.113    6.793    0.000
#>    .x5                0.227    0.136    1.675    0.094
#>    .x6                0.472    0.108    4.378    0.000
#>     f1                0.073    0.063    1.161    0.245
#>     f2                0.149    0.078    1.926    0.054
#>
inf_out <- influence_stat(fit)
gcd_plot(inf_out)