Set the attributes of the borders of selected nodes.
Usage
set_node_border_color(semPaths_plot, border_color = NULL, check_nodes = TRUE)

set_node_border_width(
  semPaths_plot,
  border_width = NULL,
  how = c("ratio", "value"),
  check_nodes = TRUE
)
Arguments
- semPaths_plot
A qgraph::qgraph object generated by semPlot::semPaths, or a similar qgraph object modified by other semptools functions. It can also be a list of qgraph::qgraph objects, probably though not necessarily from a multigroup model. If it is a list of qgraph::qgraph objects, then the function will be applied to all the objects.
- border_color
A named vector or a list of named list. See the Details section on how to set this argument.
- check_nodes
Logical. If
TRUEand at least one node specified invaluesare not insemPaths_plot.- border_width
A named vector or a list of named list. See the Details section on how to set this argument.
- how
How the width will be changed. If
"ratio", then the new width is the original width multiplied by the supplied value. If"value", then the new width is set to the supplied value.
Value
A qgraph::qgraph based on
the original one, with the corresponding
attribute of
of selected nodes changed.
If semPaths_plot is a list of
qgraph::qgraph objects, then a
list of processed qgraph::qgraph objects
will be returned.
Details
Modify a qgraph::qgraph object generated by semPlot::semPaths and change the attributes of the borders of selected nodes.
Setting the value of border_color
and border_width
This argument can be set in three ways.
For a named vector, the name of an element should be the nodes for which the attributes are to be changed. The names need to the displayed names if plotted, which may be different from the names in the model.
For example, to change the color of
x, the name should be "x".
Therefore, c("y" = "red", "x" = "blue") changes the colors of the
nodes y and x to "red" and
"blue", respectively.
For a list of named lists, each named
list should have two named values:
node, plus new_border_color or
new_border_width.
The second approach is no longer recommended, though kept for backward compatibility.
The last approach is setting
border_color or
border_width to a one-element
vector with no name. All nodes in
plot will then have the corresponding
attributes set to this value.
Note on Border Width
There are also two modes for changing
border width. If how = "ratio",
then the new border width is equal to
the original border width multiplied
by the supplied value. For example,
if the supplied value is 2, and the
original border width is 1.5, the new
border width is 3.
If how = "value", then the new
border width is set to the user
supplied value. For example, if the
supplied value is 2, then the new
border width is 2, regardless of the
original border width.
Examples
mod_pa <-
'x1 ~~ x2
x3 ~ x1 + x2
x4 ~ x1 + x3
'
fit_pa <- lavaan::sem(mod_pa, pa_example)
m <- matrix(c("x1", NA, NA,
NA, "x3", "x4",
"x2", NA, NA), byrow = TRUE, 3, 3)
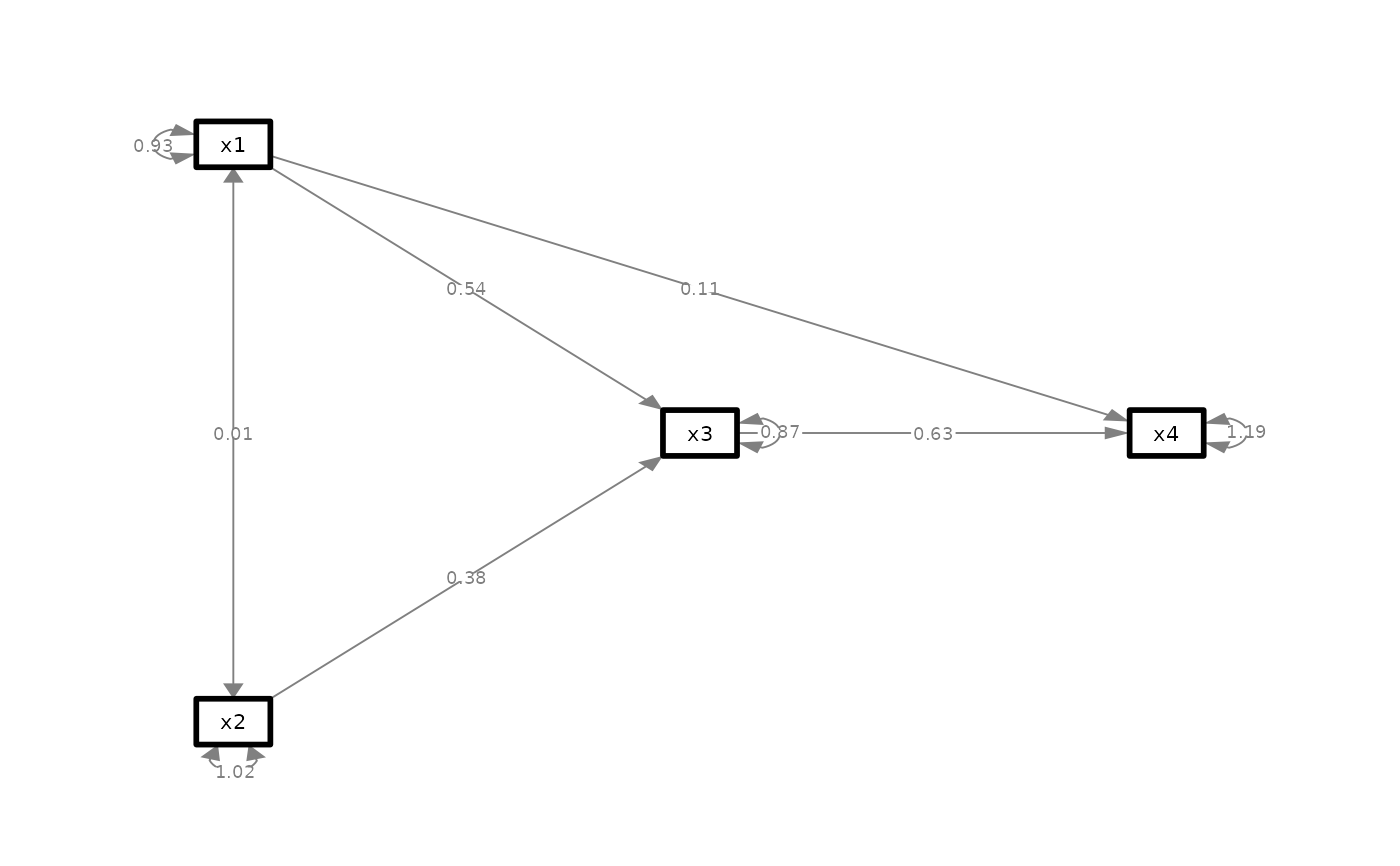
p_pa <- semPlot::semPaths(fit_pa, whatLabels="est",
style = "ram",
nCharNodes = 0, nCharEdges = 0,
layout = m)
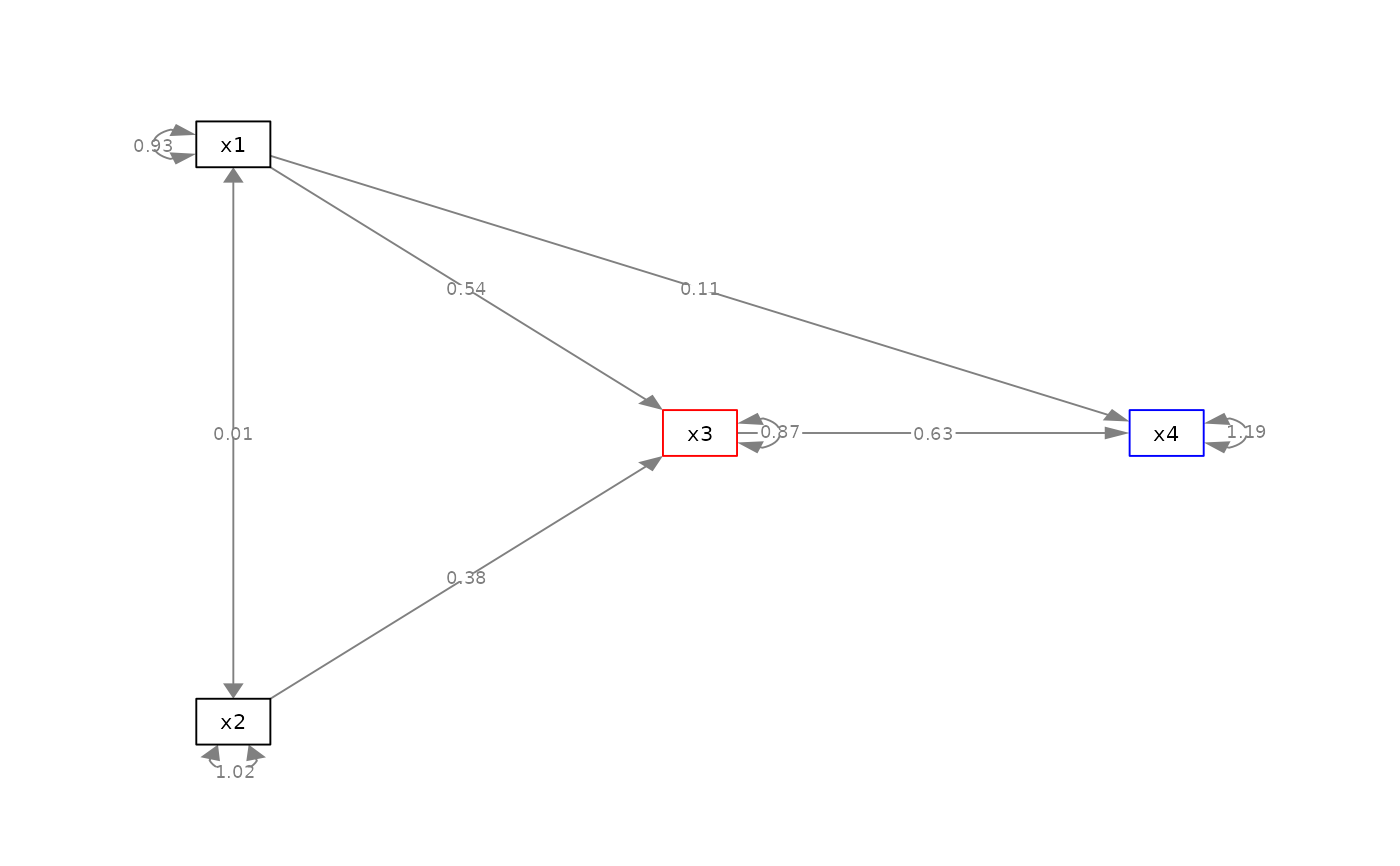
 my_border_color_vector <- c(x3 = "red", x4 = "blue")
p_pa2v <- set_node_border_color(p_pa, my_border_color_vector)
plot(p_pa2v)
my_border_color_vector <- c(x3 = "red", x4 = "blue")
p_pa2v <- set_node_border_color(p_pa, my_border_color_vector)
plot(p_pa2v)
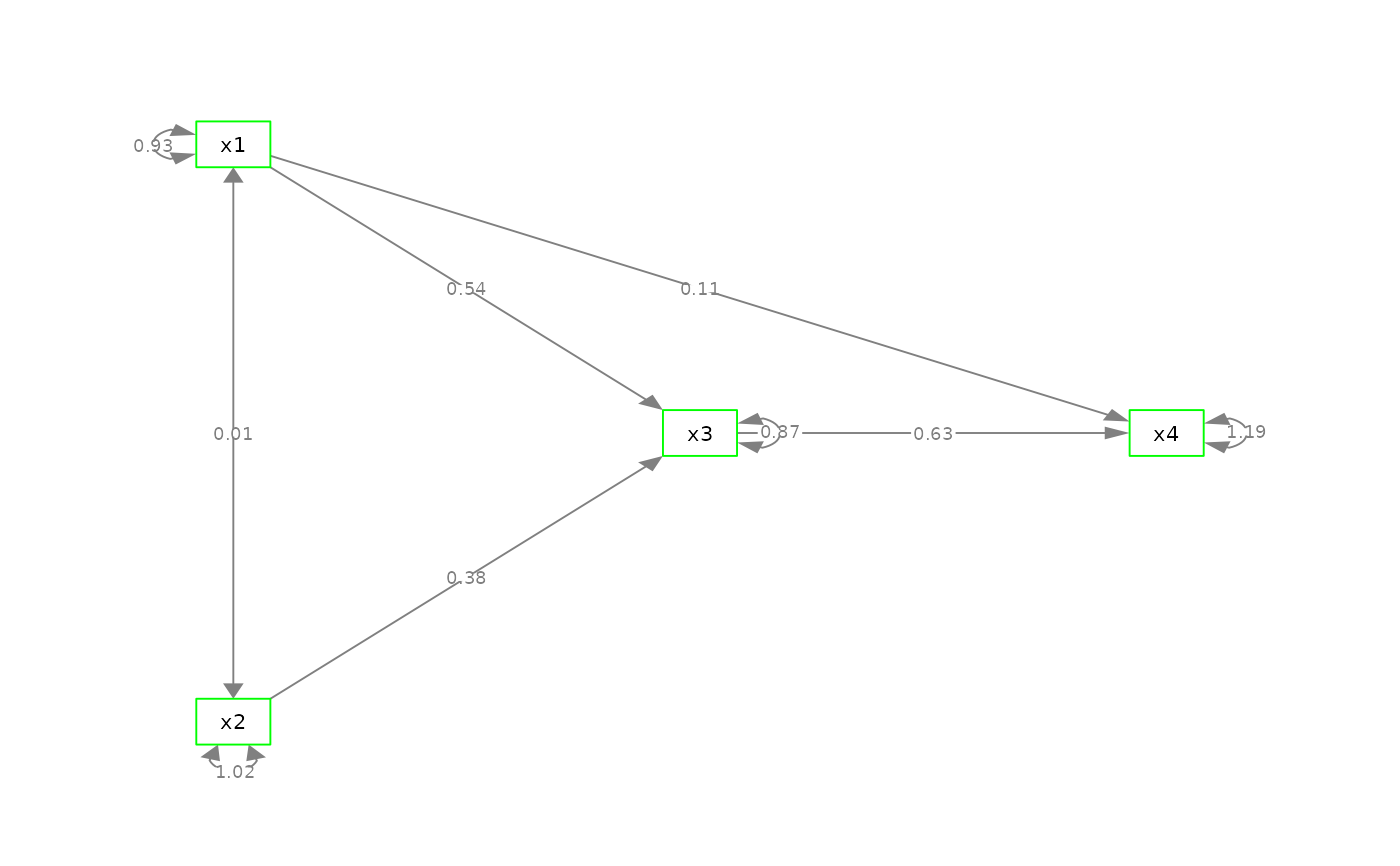
 p_pa2l <- set_node_border_color(p_pa, "green")
plot(p_pa2l)
p_pa2l <- set_node_border_color(p_pa, "green")
plot(p_pa2l)
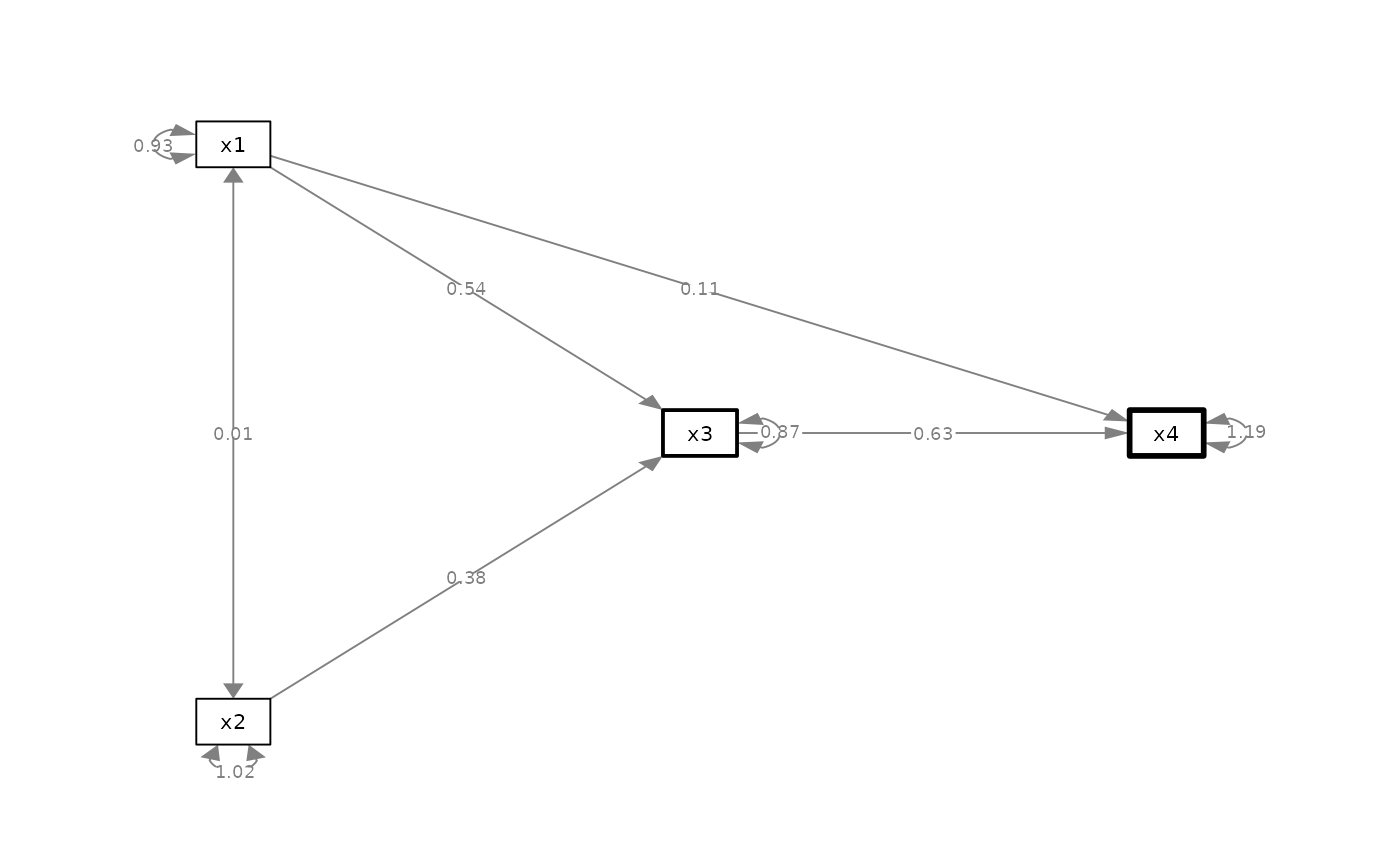
 my_border_width_vector <- c(x3 = 2, x4 = 3)
p_pa3v <- set_node_border_width(p_pa, my_border_width_vector)
plot(p_pa3v)
my_border_width_vector <- c(x3 = 2, x4 = 3)
p_pa3v <- set_node_border_width(p_pa, my_border_width_vector)
plot(p_pa3v)
 p_pa3l <- set_node_border_width(p_pa, 3)
plot(p_pa3l)
p_pa3l <- set_node_border_width(p_pa, 3)
plot(p_pa3l)