Set some attributes of a plot.
Usage
set_graph_margins(
  semPaths_plot,
  bottom,
  left,
  top,
  right,
  how = c("ratio", "value")
)

node_labels_equal_scale(semPaths_plot, equal_scale)

set_node_labels_equal_scale(semPaths_plot)
Arguments
- semPaths_plot
A qgraph::qgraph object generated by semPlot::semPaths, or a similar qgraph object modified by other semptools functions. It can also be a list of qgraph::qgraph objects, probably though not necessarily from a multigroup model. If it is a list of qgraph::qgraph objects, then the function will be applied to all the objects.
- bottom, left, right, top
The values for the corresponding sides. Please refer to 'Details' on how these values are used. Their default values depend on
how: Equal to 1 ifhow = "ratio", and equal to the original values ifhow = "value".- how
How the width will be changed. If
"ratio", then the new width is the original width multiplied by the supplied value. If"value", then the new width is set to the supplied value.- equal_scale
Logical. Set the value
label.scale.equalof the plot. If not supplied, it will not change the existing value.
Details
Functions that modify a qgraph::qgraph object generated by semPlot::semPaths and change the widths of selected attributes.
For numerical attributes, there are two possible modes.
If how = "ratio", then the new value
is equal to the old value multiplied
by the user value. For example, if
the original margins are c(2, 3, 4, 5)
and the user value is 2, then the new
margins are c(4, 6, 8, 10). If the
user values are c(3, 1, 1, 1), then
the new margins are c(6, 3, 4, 5).
If how = "value", then the new value
is equal to the user value. For example, if
the original margins are c(2, 3, 4, 5)
and the user value is 2, then the new
margins are c(2, 2, 2, 2). If
the user values are c(1, 3, 5, 7),
then the new margins are c(1, 3, 5, 7).
The function set_graph_margins() is
for modifying the margins of a generated
plot. It can be useful for increasing
or decreasing one or more margins of
a plot without regenerating it.
The function node_labels_equal_scale() is
for setting the value label.scale.equal
of a plot. By default, label.scale.equal
may be FALSE, and the labels of nodes
may be of different font sizes.
Use this function, with equal_scale
set to TRUE, will make all node labels
have the same font size.
The function set_node_labels_equal_scale()
is just a wrapper of node_labels_equal_scale()
with equal_scale set to TRUE.
Examples
mod_pa <-
'x1 ~~ x2
x3 ~ x1 + x2
x4 ~ x1 + x3
'
fit_pa <- lavaan::sem(mod_pa, pa_example)
lavaan::parameterEstimates(fit_pa)[, c("lhs", "op", "rhs", "est", "pvalue")]
#> lhs op rhs est pvalue
#> 1 x1 ~~ x2 0.005 0.957
#> 2 x3 ~ x1 0.537 0.000
#> 3 x3 ~ x2 0.376 0.000
#> 4 x4 ~ x1 0.111 0.382
#> 5 x4 ~ x3 0.629 0.000
#> 6 x3 ~~ x3 0.874 0.000
#> 7 x4 ~~ x4 1.194 0.000
#> 8 x1 ~~ x1 0.933 0.000
#> 9 x2 ~~ x2 1.017 0.000
m <- matrix(c("x1", NA, NA,
NA, "x3", "x4",
"x2", NA, NA), byrow = TRUE, 3, 3)
p_pa <- semPlot::semPaths(fit_pa, whatLabels="est",
style = "ram",
nCharNodes = 0, nCharEdges = 0,
layout = m)
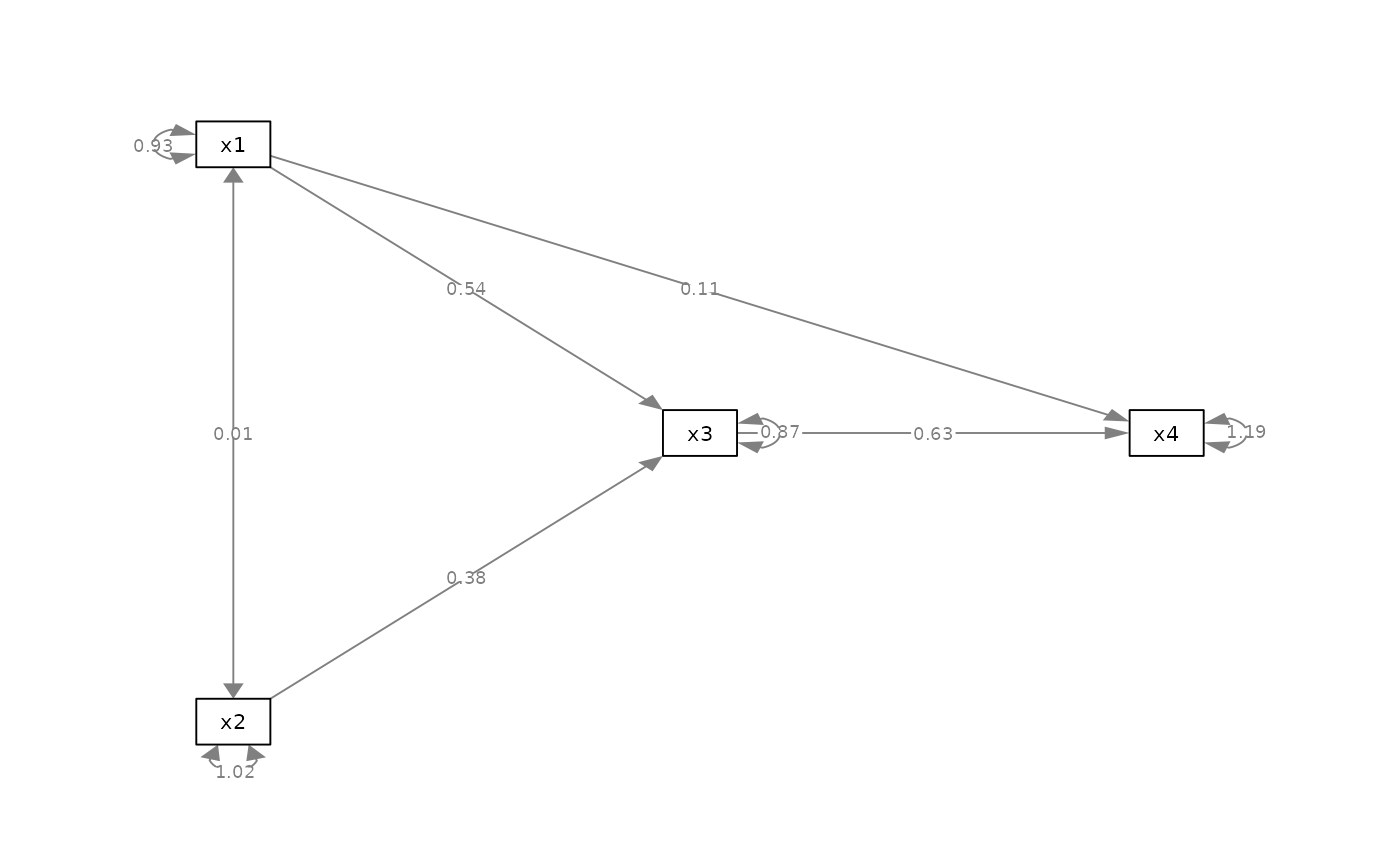 # ==== set_graph_margins ====
p2 <- set_graph_margins(p_pa, bottom = 2)
plot(p2)
# ==== set_graph_margins ====
p2 <- set_graph_margins(p_pa, bottom = 2)
plot(p2)
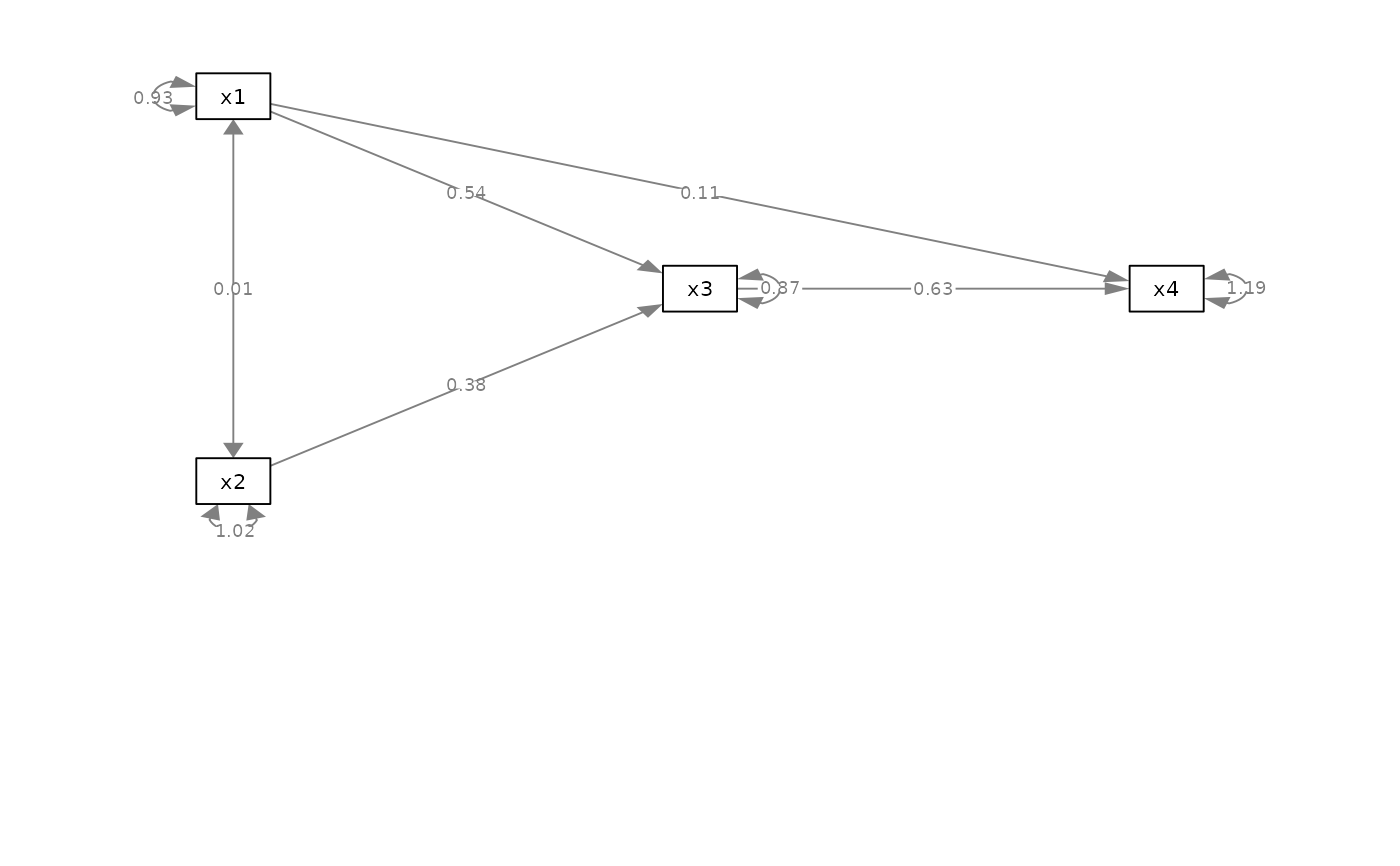
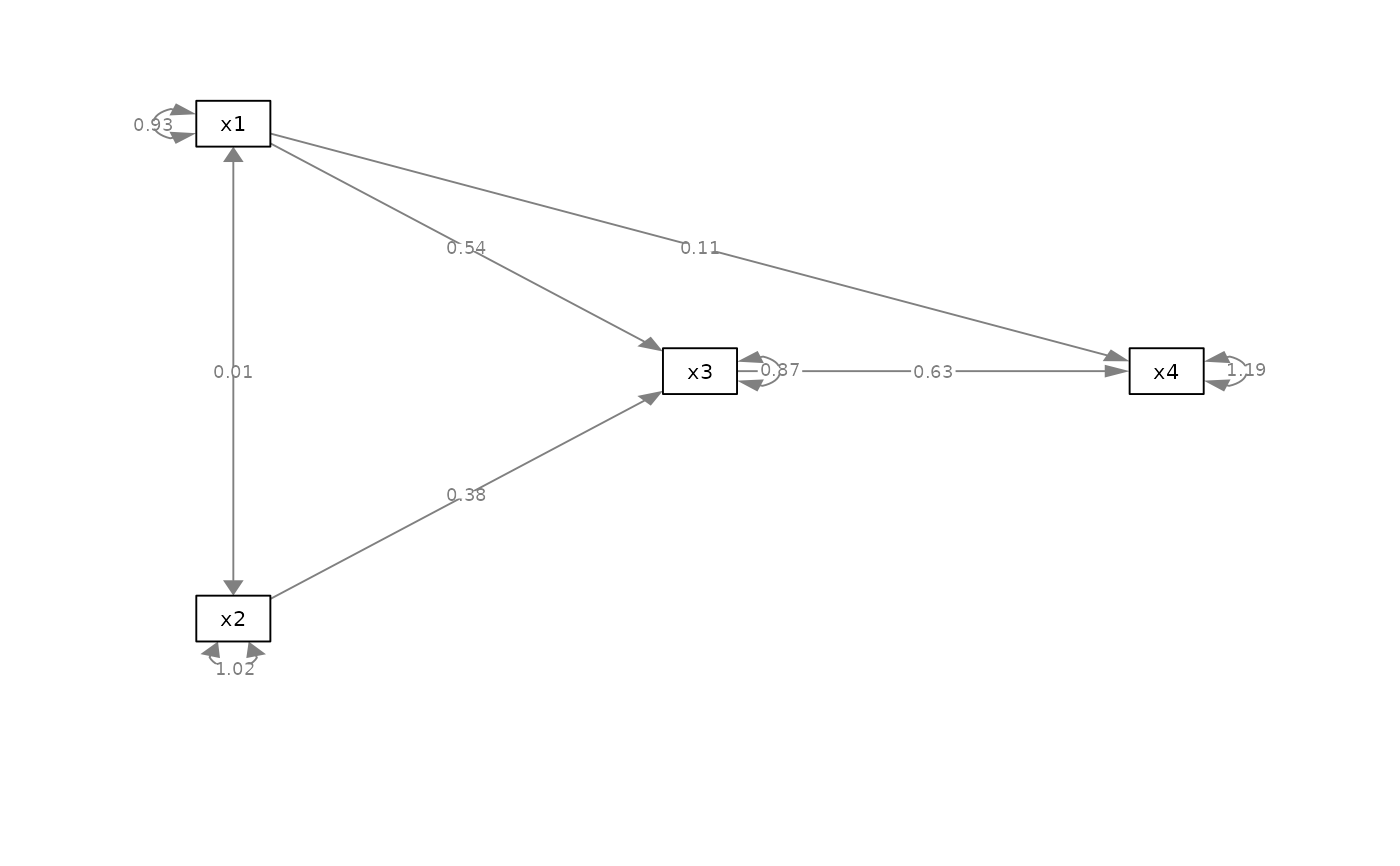 p3 <- set_graph_margins(p_pa, bottom = 2, how = "value")
plot(p3)
p3 <- set_graph_margins(p_pa, bottom = 2, how = "value")
plot(p3)
 # ==== node_labels_equal_scale ====
dat <- pa_example
colnames(dat)[1] <- "Mediator"
mod_pa2 <-
'x1 ~~ x2
Mediator ~ x1 + x2
x4 ~ x1 + Mediator
'
fit_pa2 <- lavaan::sem(mod_pa2, dat)
m2 <- matrix(c("x1", NA, NA,
NA, "Mediator", "x4",
"x2", NA, NA), byrow = TRUE, 3, 3)
p_pa2 <- semPlot::semPaths(fit_pa2, whatLabels="est",
style = "ram",
nCharNodes = 0, nCharEdges = 0,
sizeMan = 10,
layout = m2)
# ==== node_labels_equal_scale ====
dat <- pa_example
colnames(dat)[1] <- "Mediator"
mod_pa2 <-
'x1 ~~ x2
Mediator ~ x1 + x2
x4 ~ x1 + Mediator
'
fit_pa2 <- lavaan::sem(mod_pa2, dat)
m2 <- matrix(c("x1", NA, NA,
NA, "Mediator", "x4",
"x2", NA, NA), byrow = TRUE, 3, 3)
p_pa2 <- semPlot::semPaths(fit_pa2, whatLabels="est",
style = "ram",
nCharNodes = 0, nCharEdges = 0,
sizeMan = 10,
layout = m2)
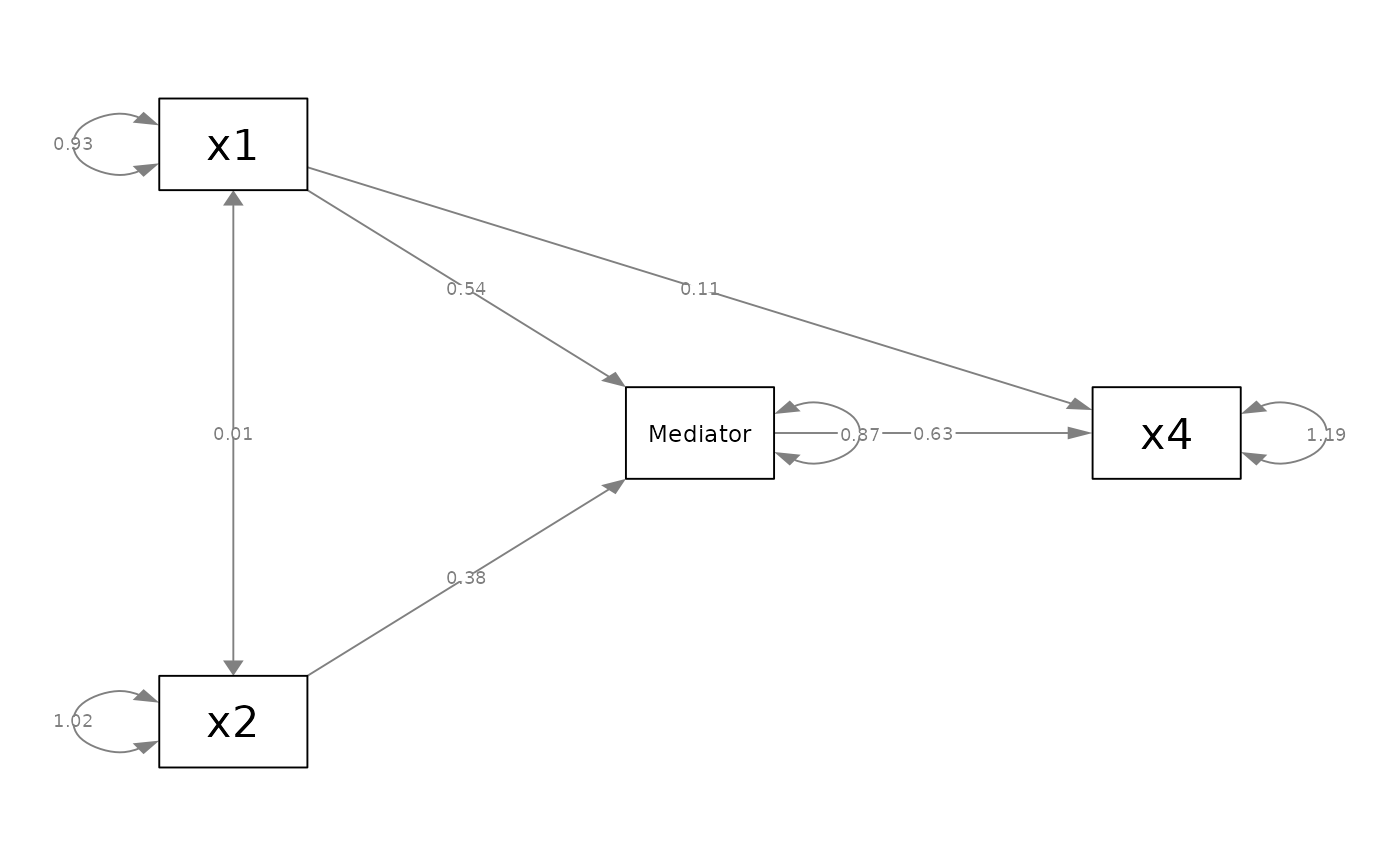 p4 <- node_labels_equal_scale(p_pa2, TRUE)
plot(p4)
p4 <- node_labels_equal_scale(p_pa2, TRUE)
plot(p4)
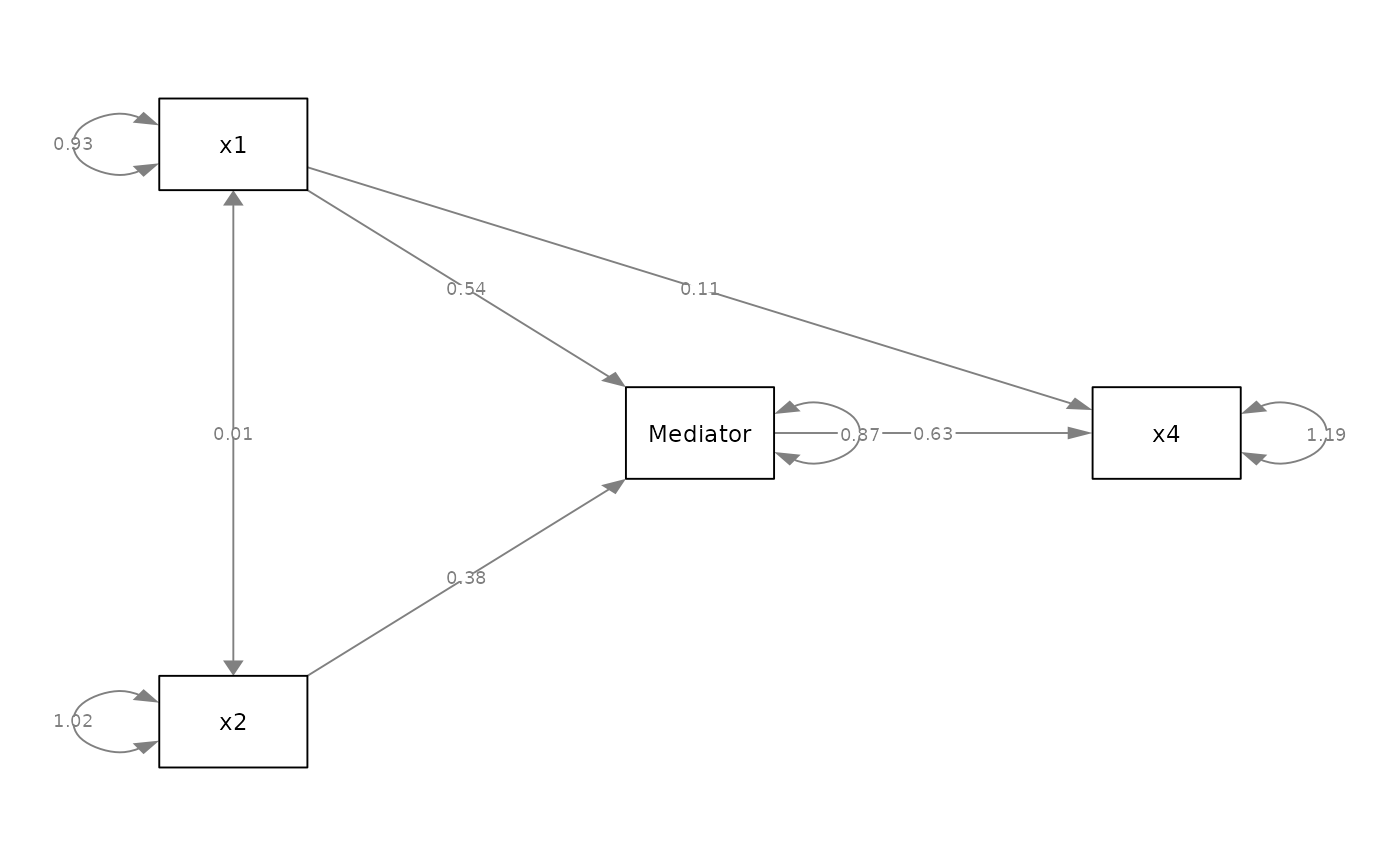 p5 <- set_node_labels_equal_scale(p_pa2)
plot(p5)
p5 <- set_node_labels_equal_scale(p_pa2)
plot(p5)