Set the curve attributes of selected edges.
Usage
set_curve(
  semPaths_plot,
  curve_list = NULL,
  how = c("value", "ratio"),
  check_direction = TRUE
)
Arguments
- semPaths_plot
A qgraph::qgraph object generated by semPlot::semPaths, or a similar qgraph object modified by other semptools functions. It can also be a list of qgraph::qgraph objects, probably though not necessarily from a multigroup model. If it is a list of qgraph::qgraph objects, then the function will be applied to all the objects.
- curve_list
A named vector or a list of named list. For a named vector, the name of an element should be the path as specified by lavaan::model.syntax or as appeared in
lavaan::parameterEstimates(). For example, to change the curve attribute of the path regressingyonx, the name should be"y ~ x". To change the curve attribute of the covariance betweenx1andx2, the name should be"x1 ~~ x2". For example,c("y ~ x1" = -3, "x1 ~~ x2" = 2)change the curve attributes of the path fromx1toyand the covariance betweenx1andx2to -3 and 2, respectively. The order of the two nodes may matter for covariances. Therefore, if the curve of a covariance is not changed, try switching the order of the two nodes. For a list of named lists, each named list should have three named values:from,to, andnew_curve. The curve attribute of the edge fromfromtotowill be set tonew_curve.- how
How the width will be changed. If
"ratio", then the new width is the original width multiplied by the supplied value. If"value", then the new width is set to the supplied value.- check_direction
If
FALSE, the direction of an edge is ignored. For example, bothy ~ xandx ~ ywill affecty ~ x,x ~ y, andy ~~ x. Useful when we want to change an edge regardless of its direction and whether it is directional.
Value
A qgraph::qgraph based on the original one, with curve
attributes for selected edges changed.
If semPaths_plot is a list of
qgraph::qgraph objects, then a
list of processed qgraph::qgraph objects
will be returned.
Details
Modified a qgraph::qgraph object generated by semPlot::semPaths and change the curve attributes of selected edges.
If how is set to "ratio", then the
new curve value is equal to the
old curve value multiplied by the
supplied value. This mode lets users
increase or decrease the curvature
of a curve without knowing the original
value.
Examples
mod_pa <-
'x1 ~~ x2
x3 ~ x1 + x2
x4 ~ x1 + x3
'
fit_pa <- lavaan::sem(mod_pa, pa_example)
lavaan::parameterEstimates(fit_pa)[, c("lhs", "op", "rhs", "est", "pvalue")]
#> lhs op rhs est pvalue
#> 1 x1 ~~ x2 0.005 0.957
#> 2 x3 ~ x1 0.537 0.000
#> 3 x3 ~ x2 0.376 0.000
#> 4 x4 ~ x1 0.111 0.382
#> 5 x4 ~ x3 0.629 0.000
#> 6 x3 ~~ x3 0.874 0.000
#> 7 x4 ~~ x4 1.194 0.000
#> 8 x1 ~~ x1 0.933 0.000
#> 9 x2 ~~ x2 1.017 0.000
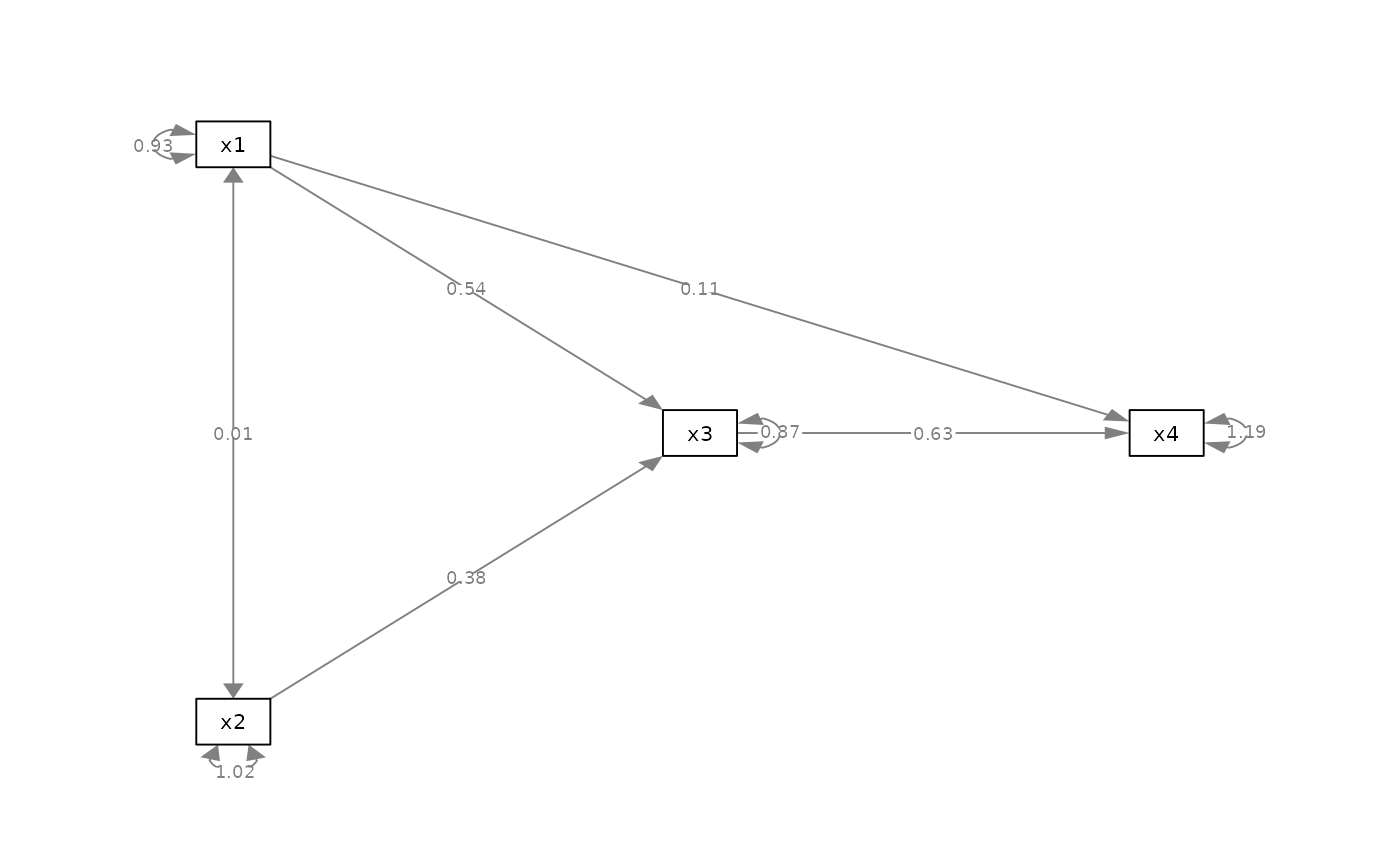
m <- matrix(c("x1", NA, NA,
NA, "x3", "x4",
"x2", NA, NA), byrow = TRUE, 3, 3)
p_pa <- semPlot::semPaths(fit_pa, whatLabels="est",
style = "ram",
nCharNodes = 0, nCharEdges = 0,
layout = m)
 my_curve_vector <- c("x2 ~~ x1" = -1,
"x4 ~ x1" = 1)
p_pa2v <- set_curve(p_pa, my_curve_vector)
plot(p_pa2v)
my_curve_vector <- c("x2 ~~ x1" = -1,
"x4 ~ x1" = 1)
p_pa2v <- set_curve(p_pa, my_curve_vector)
plot(p_pa2v)
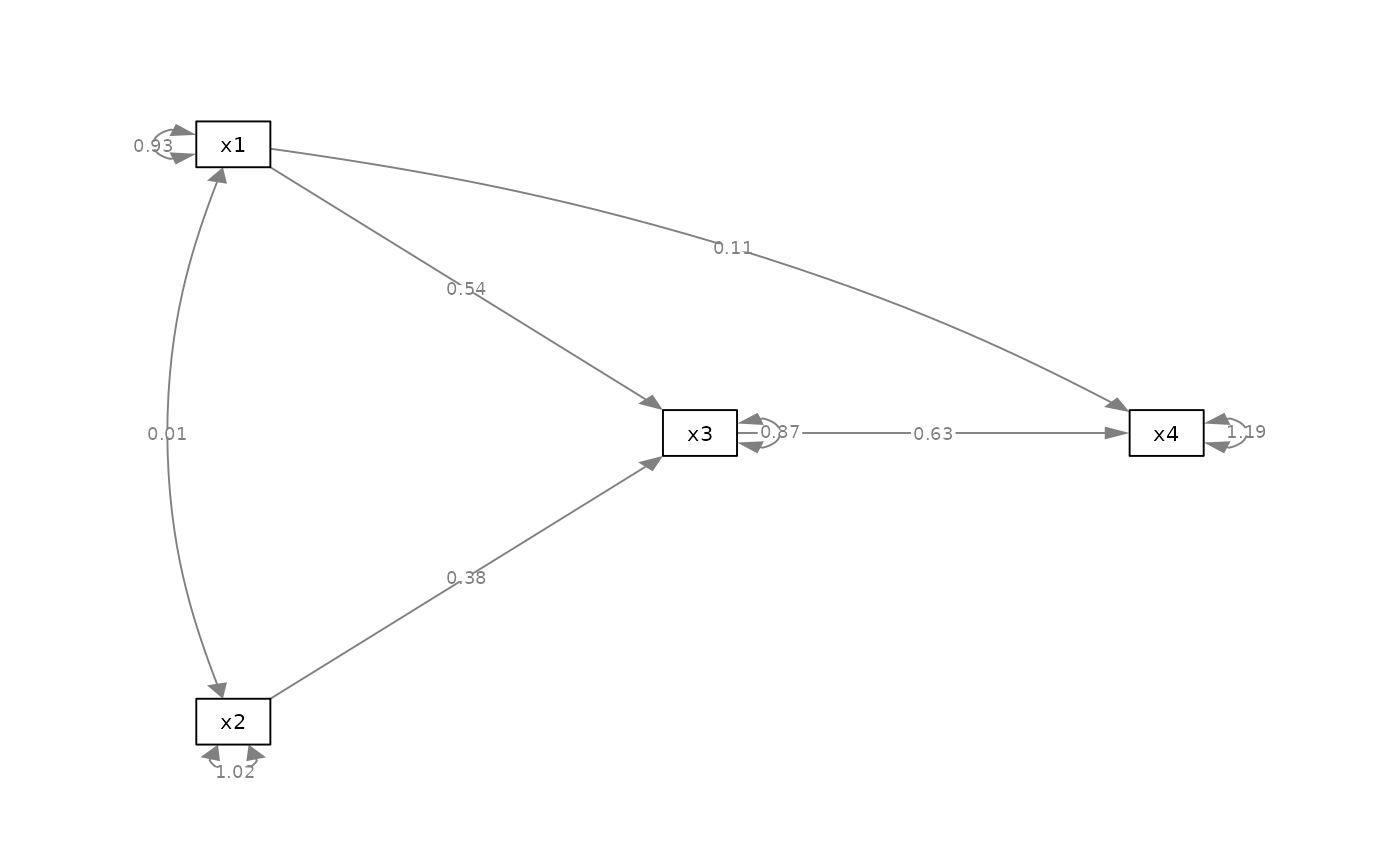 my_curve_list <- list(list(from = "x1", to = "x2", new_curve = -1),
list(from = "x1", to = "x4", new_curve = 1))
p_pa2l <- set_curve(p_pa, my_curve_list)
plot(p_pa2l)
my_curve_list <- list(list(from = "x1", to = "x2", new_curve = -1),
list(from = "x1", to = "x4", new_curve = 1))
p_pa2l <- set_curve(p_pa, my_curve_list)
plot(p_pa2l)