Rotate the residuals of selected nodes.
Arguments
- semPaths_plot
A qgraph::qgraph object generated by semPlot::semPaths, or a similar qgraph object modified by other semptools functions. It can also be a list of qgraph::qgraph objects, probably though not necessarily from a multigroup model. If it is a list of qgraph::qgraph objects, then the function will be applied to all the objects.
- rotate_resid_list
A named vector or a list of named list. For a named vector, the name of an element is the node for which its residual is to be rotated, and the value is the degree to rotate. The 12 o'clock position is zero degree. Positive degree denotes clockwise rotation, and negative degree denotes anticlockwise rotation. For example,
c(x3 = 45, x4 = -45)means rotating the residual ofx345 degrees clockwise, and rotating the residual ofx445 degrees anticlockwise. For a list of named lists, each named list should have two named values:nodeandrotate. The position of the residual ofnodewill be placed atrotate, in degree. For example,list(list(node = "x3", rotate = 45), list(node = "x4", rotate = -45))is equivalent toc(x3 = 45, x4 = -45).- check_nodes
Logical. If
TRUEand at least one node specified invaluesare not insemPaths_plot.
Value
A qgraph::qgraph object based on the original one, with
loopRotation attributes of selected nodes modified.
If semPaths_plot is a list of
qgraph::qgraph objects, then a
list of processed qgraph::qgraph objects
will be returned.
Details
Modify a qgraph::qgraph object generated by semPlot::semPaths and rotate the residuals of selected nodes. Currently only supports "ram" and similar styles of semPlot::semPaths.
Examples
mod_pa <-
'x1 ~~ x2
x3 ~ x1 + x2
x4 ~ x1 + x3
'
fit_pa <- lavaan::sem(mod_pa, pa_example)
lavaan::parameterEstimates(fit_pa)[, c("lhs", "op", "rhs", "est", "pvalue")]
#> lhs op rhs est pvalue
#> 1 x1 ~~ x2 0.005 0.957
#> 2 x3 ~ x1 0.537 0.000
#> 3 x3 ~ x2 0.376 0.000
#> 4 x4 ~ x1 0.111 0.382
#> 5 x4 ~ x3 0.629 0.000
#> 6 x3 ~~ x3 0.874 0.000
#> 7 x4 ~~ x4 1.194 0.000
#> 8 x1 ~~ x1 0.933 0.000
#> 9 x2 ~~ x2 1.017 0.000
m <- matrix(c("x1", NA, NA,
NA, "x3", "x4",
"x2", NA, NA), byrow = TRUE, 3, 3)
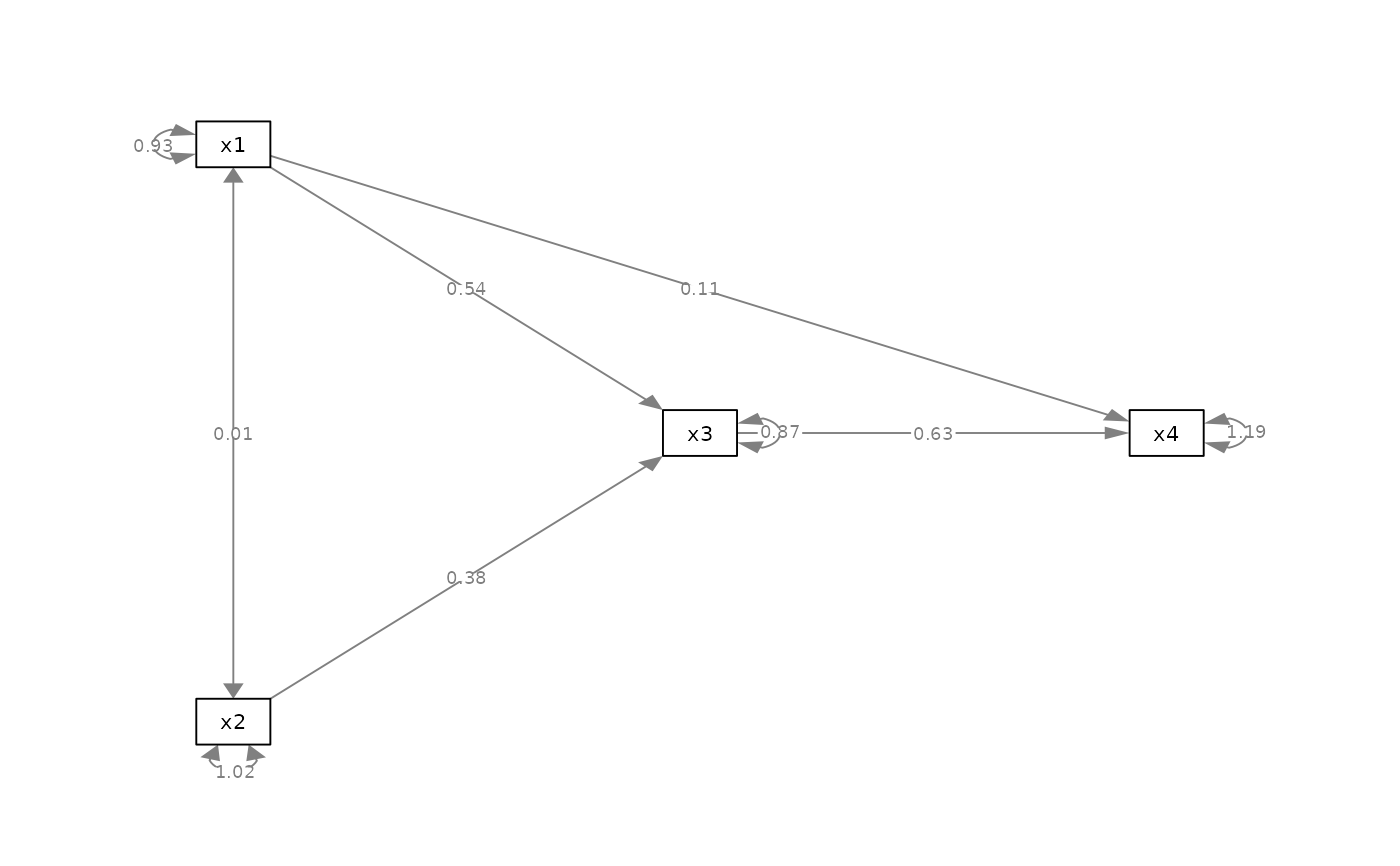
p_pa <- semPlot::semPaths(fit_pa, whatLabels="est",
style = "ram",
nCharNodes = 0, nCharEdges = 0,
layout = m)
 my_rotate_resid_vector <- c(x3 = 45, x4 = -45)
p_pa2v <- rotate_resid(p_pa, my_rotate_resid_vector)
plot(p_pa2v)
my_rotate_resid_vector <- c(x3 = 45, x4 = -45)
p_pa2v <- rotate_resid(p_pa, my_rotate_resid_vector)
plot(p_pa2v)
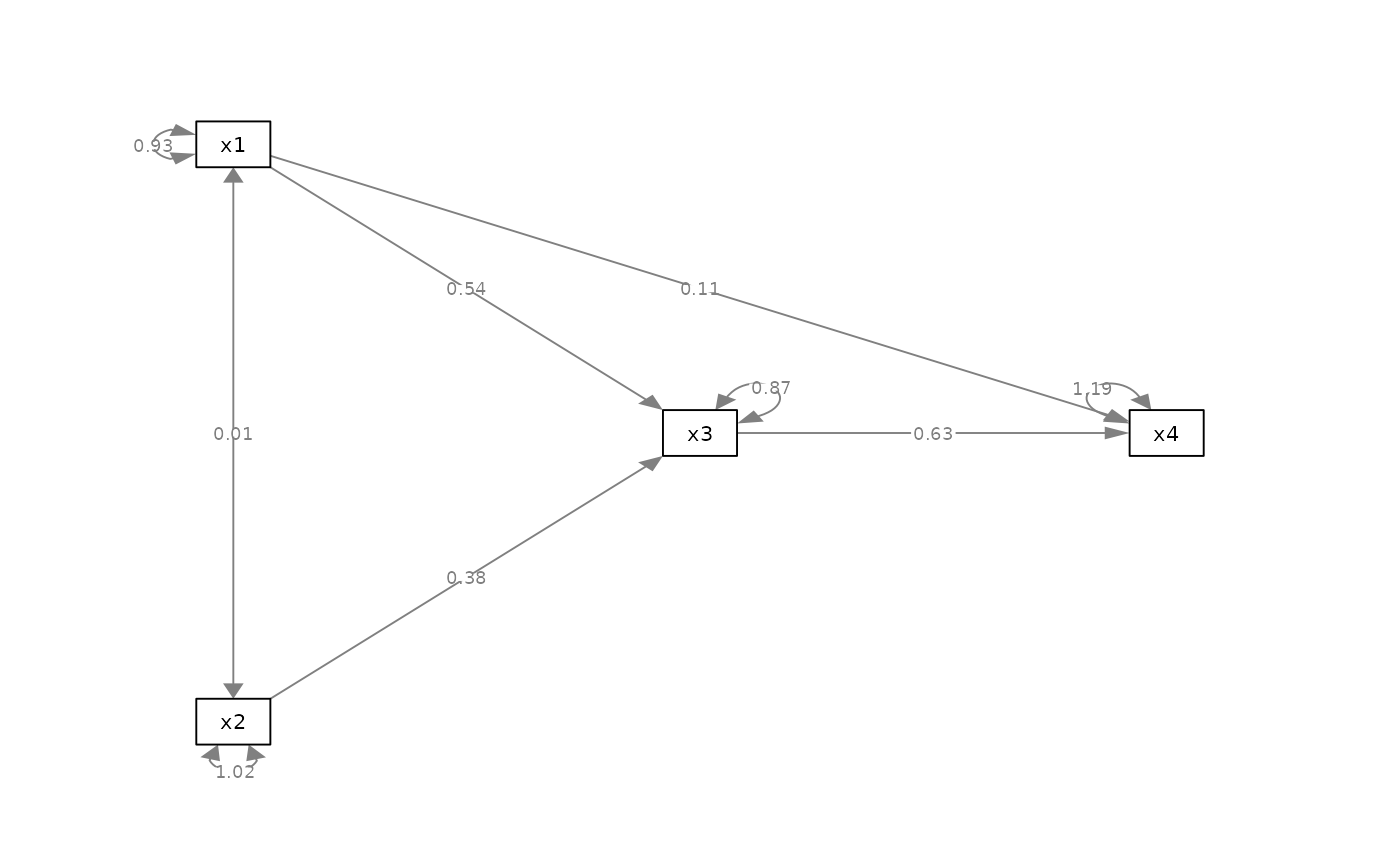 my_rotate_resid_list <- list(list(node = "x3", rotate = 45),
list(node = "x4", rotate = -45))
p_pa2l <- rotate_resid(p_pa, my_rotate_resid_list)
plot(p_pa2l)
my_rotate_resid_list <- list(list(node = "x3", rotate = 45),
list(node = "x4", rotate = -45))
p_pa2l <- rotate_resid(p_pa, my_rotate_resid_list)
plot(p_pa2l)