Move the nodes in an
plot generated by semPlot::semPaths().
Arguments
- semPaths_plot
A qgraph::qgraph object generated by semPlot::semPaths, or a similar qgraph object modified by other semptools functions. It can also be a list of qgraph::qgraph objects, probably though not necessarily from a multigroup model. If it is a list of qgraph::qgraph objects, then the function will be applied to all the objects.
- move_by
A named list. The names are the names of nodes to be moved. Each element of the list can be either a named numeric vector or an unnamed vector of two numbers. If a named vector,
xis the horizontal change in the position (e.g., .25 means moving to the right by .25, and -.5 means moving to the left by .5), andyis the vertical change (e.g., .5 means moving up by .5, and -.1 means moving down by .1). If unnamed, then the vector must have two numbers, the first for the horizontal move (x) and the second for the vertical move. The value is interpreted based on the unit of the plot, usually from -1 to 1 forxandy, with 0 being the center of the plot.- check_nodes
Logical. If
TRUEand at least one node specified invaluesare not insemPaths_plot.
Value
A qgraph::qgraph based on
the original one, with the selected
nodes moved.
If semPaths_plot is a list of
qgraph::qgraph objects, then a
list of processed qgraph::qgraph objects
will be returned.
Details
Modify a qgraph::qgraph object generated by semPlot::semPaths and move selected nodes.
The change assumes that the layout is defined with 0 as the center, -1 to 1 from left to right, and from bottom to top.
Examples
mod_pa <-
'x1 ~~ x2
x3 ~ x1 + x2
x4 ~ x1 + x3
'
fit_pa <- lavaan::sem(mod_pa, pa_example)
lavaan::parameterEstimates(fit_pa)[, c("lhs", "op", "rhs", "est", "pvalue")]
#> lhs op rhs est pvalue
#> 1 x1 ~~ x2 0.005 0.957
#> 2 x3 ~ x1 0.537 0.000
#> 3 x3 ~ x2 0.376 0.000
#> 4 x4 ~ x1 0.111 0.382
#> 5 x4 ~ x3 0.629 0.000
#> 6 x3 ~~ x3 0.874 0.000
#> 7 x4 ~~ x4 1.194 0.000
#> 8 x1 ~~ x1 0.933 0.000
#> 9 x2 ~~ x2 1.017 0.000
m <- matrix(c("x1", NA, NA,
NA, "x3", "x4",
"x2", NA, NA), byrow = TRUE, 3, 3)
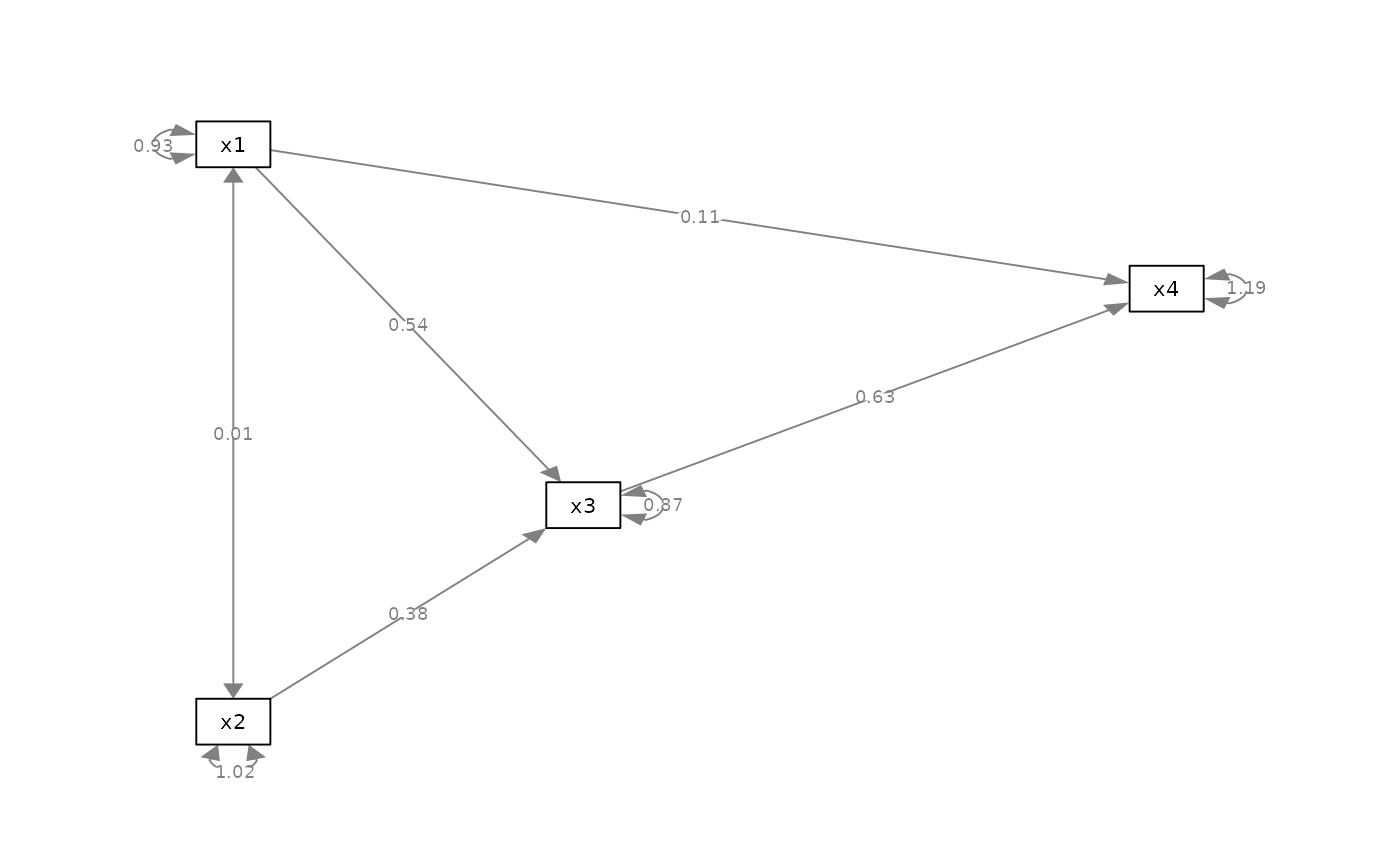
p_pa <- semPlot::semPaths(fit_pa, whatLabels="est",
style = "ram",
nCharNodes = 0, nCharEdges = 0,
layout = m)
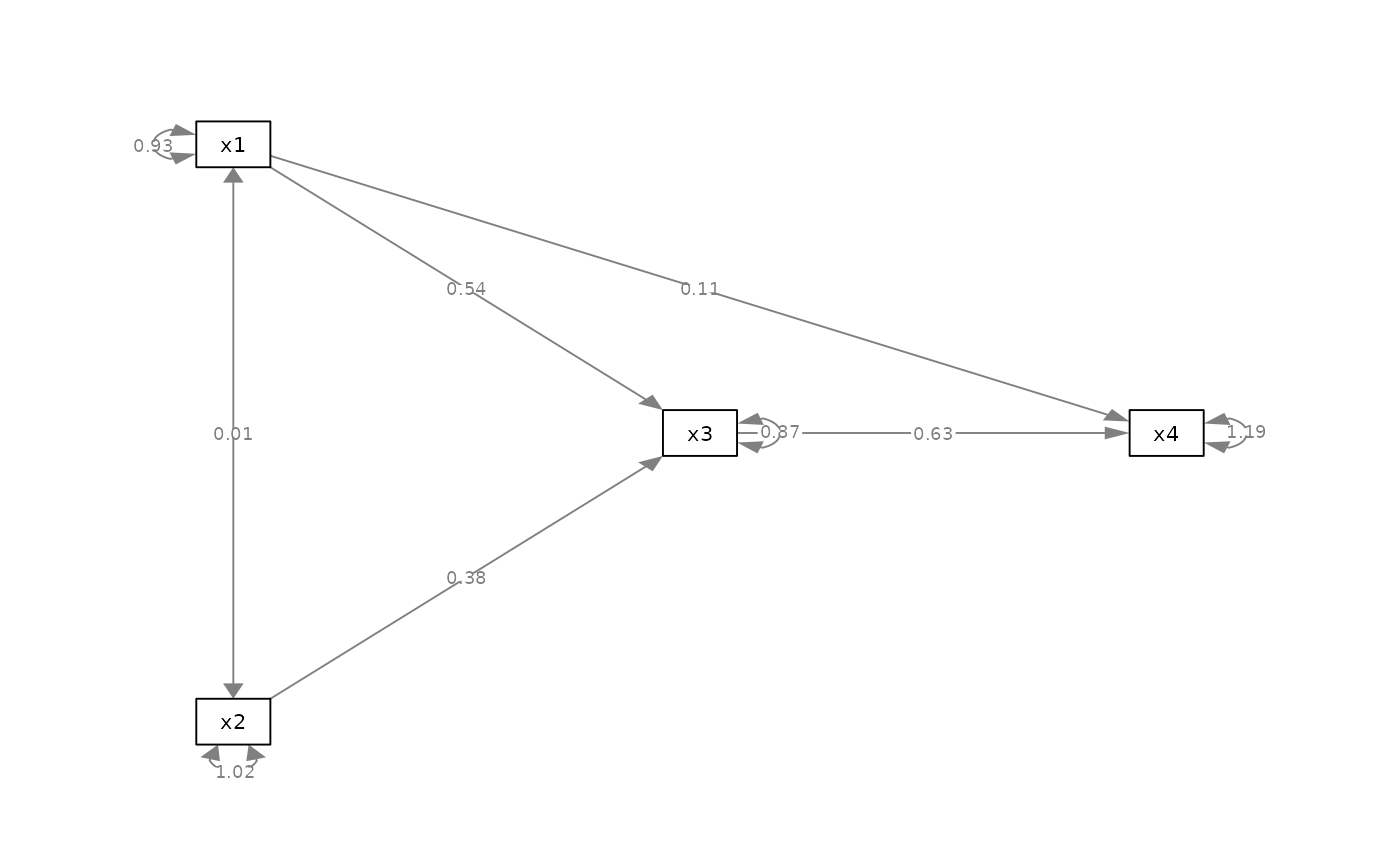 p_changed <- move_node(p_pa,
list(x3 = c(x = -.25, y = -.25),
x4 = c(y = .5)))
plot(p_changed)
p_changed <- move_node(p_pa,
list(x3 = c(x = -.25, y = -.25),
x4 = c(y = .5)))
plot(p_changed)