Get the values of an arbitrary attribute of selected edges.
Usage
get_edge_attribute(
  semPaths_plot,
  edges = NULL,
  attribute_name = NULL,
  check_direction = TRUE
)
Arguments
- semPaths_plot
A qgraph::qgraph object generated by semPlot::semPaths, or a similar qgraph object modified by other semptools functions. Unlike some other functions, this function does not support a list of qgraph::qgraph objects. If
semPaths_plotis a list of qgraph::qgraph objects, only the first object will be processed. Use functions such aslapply()manually to get the attribute values from a list of qgraph::qgraph objects.- edges
A character vector of the edges. Each edge is denoted by
lavaanmodel syntax, such asy ~ xorx1 ~~ x2. IfNULL, then the values of all edges will be retrieved.- attribute_name
The name of the attribute from which the values will be retrieved.
- check_direction
If
FALSE, the direction of an edge is ignored. For example, bothy ~ xandx ~ ywill affecty ~ x,x ~ y, andy ~~ x. Useful when we want to identify an edge regardless of its direction and whether it is directional.
Details
From a qgraph::qgraph()
object generated by
semPlot::semPaths(), get the
values of an attribute of selected
edges.
This function is designed to be a general one that gets the values of the attributes named by the user.
Setting the value of values
This argument can be set in three ways.
For a named vector, the name of an
element should be the path as
specified by lavaan::model.syntax
or as appeared in
lavaan::parameterEstimates().
For example, if the attributes to be
changed are the colors of selected
edges, to change the color of the
path regressing y on x, the name
should be "y ~ x". To change the
color of the covariance between x1
and x2, the name should be "x1 ~~ x2". Therefore, c("y ~ x1" = "red", "x1 ~~ x2" = "blue") changes the
colors of the path from x1 to y
and the covariance between x1 and
x2 to "red" and "blue",
respectively.
The order of the two nodes may matter for covariances. Therefore, if the attribute of a covariance is not changed, try switching the order of the two nodes.
For a list of named lists, each named
list should have three named values:
from, to, and new_value. The
attribute of the edge from from to
to will be set to new_value.
The second approach is no longer recommended, though kept for backward compatibility.
The last approach is setting values
to a one-element vector with no name.
All edges in plot will then have the
selected attributes set to this value.
Examples
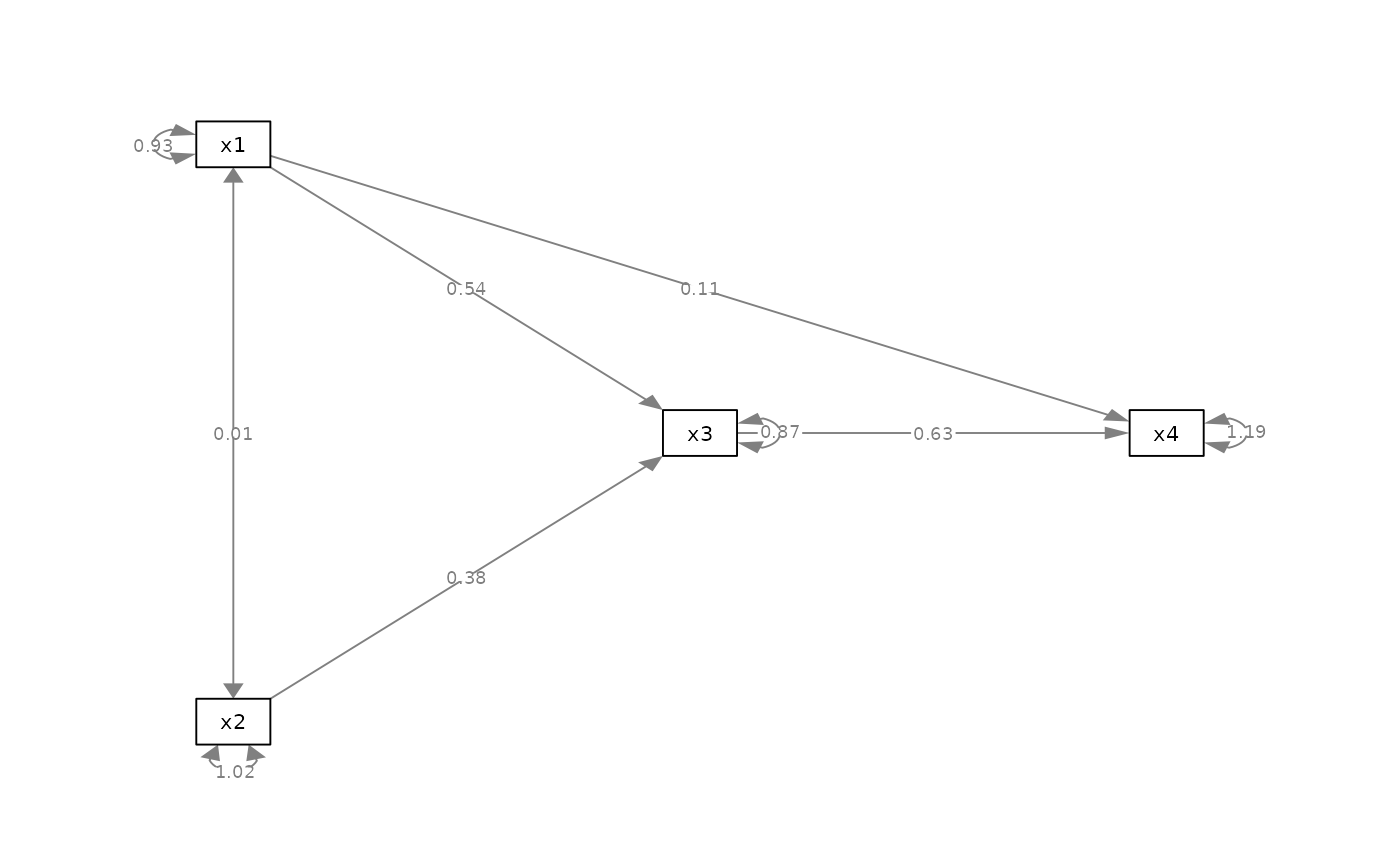
mod_pa <-
  'x1 ~~ x2
   x3 ~  x1 + x2
   x4 ~  x1 + x3
  '
fit_pa <- lavaan::sem(mod_pa, pa_example)
lavaan::parameterEstimates(fit_pa)[, c("lhs", "op", "rhs", "est", "pvalue")]
#>   lhs op rhs   est pvalue
#> 1  x1 ~~  x2 0.005  0.957
#> 2  x3  ~  x1 0.537  0.000
#> 3  x3  ~  x2 0.376  0.000
#> 4  x4  ~  x1 0.111  0.382
#> 5  x4  ~  x3 0.629  0.000
#> 6  x3 ~~  x3 0.874  0.000
#> 7  x4 ~~  x4 1.194  0.000
#> 8  x1 ~~  x1 0.933  0.000
#> 9  x2 ~~  x2 1.017  0.000
m <- matrix(c("x1",   NA,   NA,
                NA, "x3", "x4",
              "x2",   NA,   NA), byrow = TRUE, 3, 3)
p_pa <- semPlot::semPaths(fit_pa, whatLabels="est",
            style = "ram",
            nCharNodes = 0, nCharEdges = 0,
            layout = m)


get_edge_attribute(
   p_pa,
   edges = c("x2 ~~ x1", "x4 ~ x1"),
   attribute_name = "labels")
#> x2 ~~ x1  x4 ~ x1
#>   "0.01"   "0.11"

get_edge_attribute(
   p_pa,
   edges = c("x2 ~~ x1", "x4 ~ x1"),
   attribute_name = "color")
#>    x2 ~~ x1     x4 ~ x1
#> "#808080FF" "#808080FF"
get_edge_attribute(
p_pa,
edges = c("x2 ~~ x1", "x4 ~ x1"),
attribute_name = "labels")
#> x2 ~~ x1 x4 ~ x1
#> "0.01" "0.11"
get_edge_attribute(
p_pa,
edges = c("x2 ~~ x1", "x4 ~ x1"),
attribute_name = "color")
#> x2 ~~ x1 x4 ~ x1
#> "#808080FF" "#808080FF"