Change the labels of selected nodes.
Usage
change_node_label(
  semPaths_plot,
  label_list = NULL,
  label.cex,
  label.scale,
  label.prop,
  label.norm
)
Arguments
- semPaths_plot
A qgraph::qgraph object generated by semPlot::semPaths, or a similar qgraph object modified by other semptools functions.
- label_list
A list of named lists. Each named list should have two named values:
nodeandto. The first part,node, is a character denoting the label to be changed. It should be as appeared in the qgraph. The second part,to, is the new label. Expression can be used into. A named vector can also be used, with the names being the nodes to be changed, and the values the new labels.- label.cex
Identical to the same argument in
semPlot::semPaths(). A number tha control the size of labels in the nodes. It has no default. If not set, then this option in thesemPaths_plotwill not be changed.- label.scale
Identical to the same argument in semPlot::semPaths. A logical value that determine whether labels wil be scaled (resized) to the nodes they attach to. It has no default. If not set, then this option in the
semPaths_plotwill not be changed.- label.prop
Identical to the same argument in semPlot::semPaths. A numeric vector of length equal to the number of nodes. If
label.scaleisTRUE, this number is the proportion of the width of a node that its label will be scaled (resized) to. It has no default. If not set, then this option in thesemPaths_plotwill not be changed.- label.norm
Identical to the same argument in semPlot::semPaths. It must be a string. All labels as wide as or narrower than this string will have the same font size, while all labels wider than this string will be rescaled to have the same width as this string. It has no default. If not set, then this option in the
semPaths_plotwill not be changed.
Value
A qgraph::qgraph based on the original one, with node
attributes of selected nodes modified.
If semPaths_plot is a list of
qgraph::qgraph objects, then a
list of processed qgraph::qgraph objects
will be returned.
Details
Modify a qgraph::qgraph object generated by semPlot::semPaths and change the labels of selected nodes.
Examples
library(semPlot)
library(lavaan)
mod_pa <-
'x1 ~~ x2
x3 ~ x1 + x2
x4 ~ x1 + x3
'
fit_pa <- sem(mod_pa, pa_example)
parameterEstimates(fit_pa)[, c("lhs", "op", "rhs", "est", "pvalue")]
#> lhs op rhs est pvalue
#> 1 x1 ~~ x2 0.005 0.957
#> 2 x3 ~ x1 0.537 0.000
#> 3 x3 ~ x2 0.376 0.000
#> 4 x4 ~ x1 0.111 0.382
#> 5 x4 ~ x3 0.629 0.000
#> 6 x3 ~~ x3 0.874 0.000
#> 7 x4 ~~ x4 1.194 0.000
#> 8 x1 ~~ x1 0.933 0.000
#> 9 x2 ~~ x2 1.017 0.000
m <- matrix(c("x1", NA, NA,
NA, "x3", "x4",
"x2", NA, NA), byrow = TRUE, 3, 3)
p_pa <- semPaths(fit_pa, whatLabels="est",
style = "ram",
nCharNodes = 0, nCharEdges = 0,
layout = m)
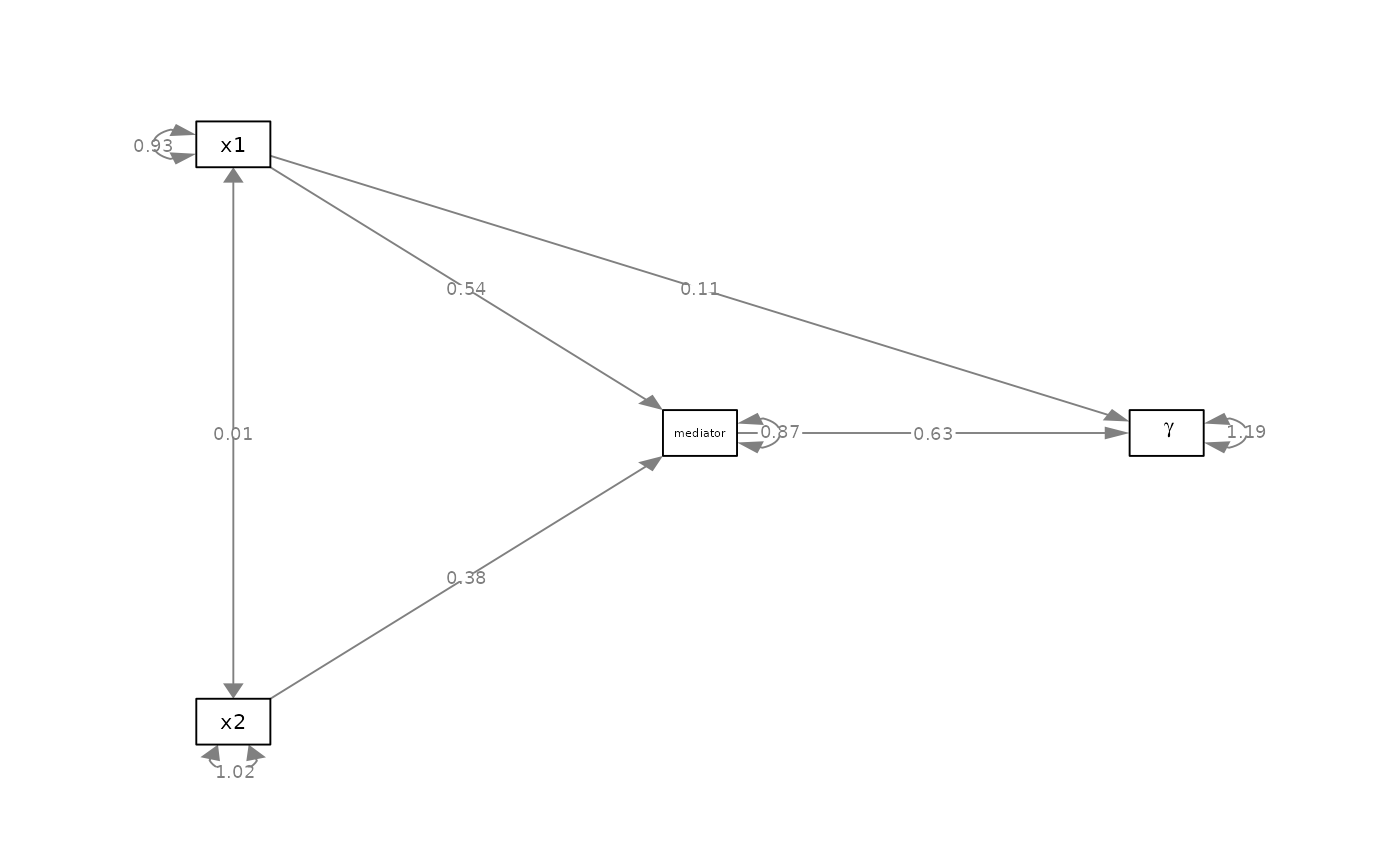
 my_label_list <- list(list(node = "x3", to = "mediator"),
list(node = "x4", to = expression(gamma)))
p_pa2 <- change_node_label(p_pa, my_label_list)
plot(p_pa2)
my_label_list <- list(list(node = "x3", to = "mediator"),
list(node = "x4", to = expression(gamma)))
p_pa2 <- change_node_label(p_pa, my_label_list)
plot(p_pa2)