Determine the Order of Indicators Automatically
Source:R/auto_indicator_order.R
auto_indicator_order.RdDetermine the order of indicators and match indicators and factors based on a plot from a 'qgraph' object.
Arguments
- semPaths_plot
A qgraph::qgraph object generated by
semPlot::semPaths(), or a similar qgraph::qgraph object modified by other semptools functions.- add_isolated_manifest
Logical. Whether observed variables that are not indicators will be included in the output as "factors", each with one indicator (the observed variable).
Value
A named character vector. The values are the indicators identified. The names are the latent factors the indicators loaded on.
Details
It inspects a qgraph::qgraph object and find variables that are the indicators of latent factors.
The output can be used in the
argument indicator_order of
set_cfa_layout() and
set_sem_layout(). It can also be
modified, such as reordered, as
necessary.
If the generated order is used, there
is no need to call this function
manually because set_cfa_layout()
and set_sem_layout() will
automatically call this function, if
indicator_order is not set.
It assumes that observed variables
are represented by squares (shape
set to "square") and latent
variables represented by circles
or ovals (shape set to "circle").
An observed variable is considered as an indicator if there is an arrow pointing to it from a latent variable.
If an indicator loaded on more than one latent variable, it will only be matched to one of them, determined by the order of appearance in the internal storage.
It uses node names, not node labels, in generating the output.
Examples
library(lavaan)
library(semPlot)
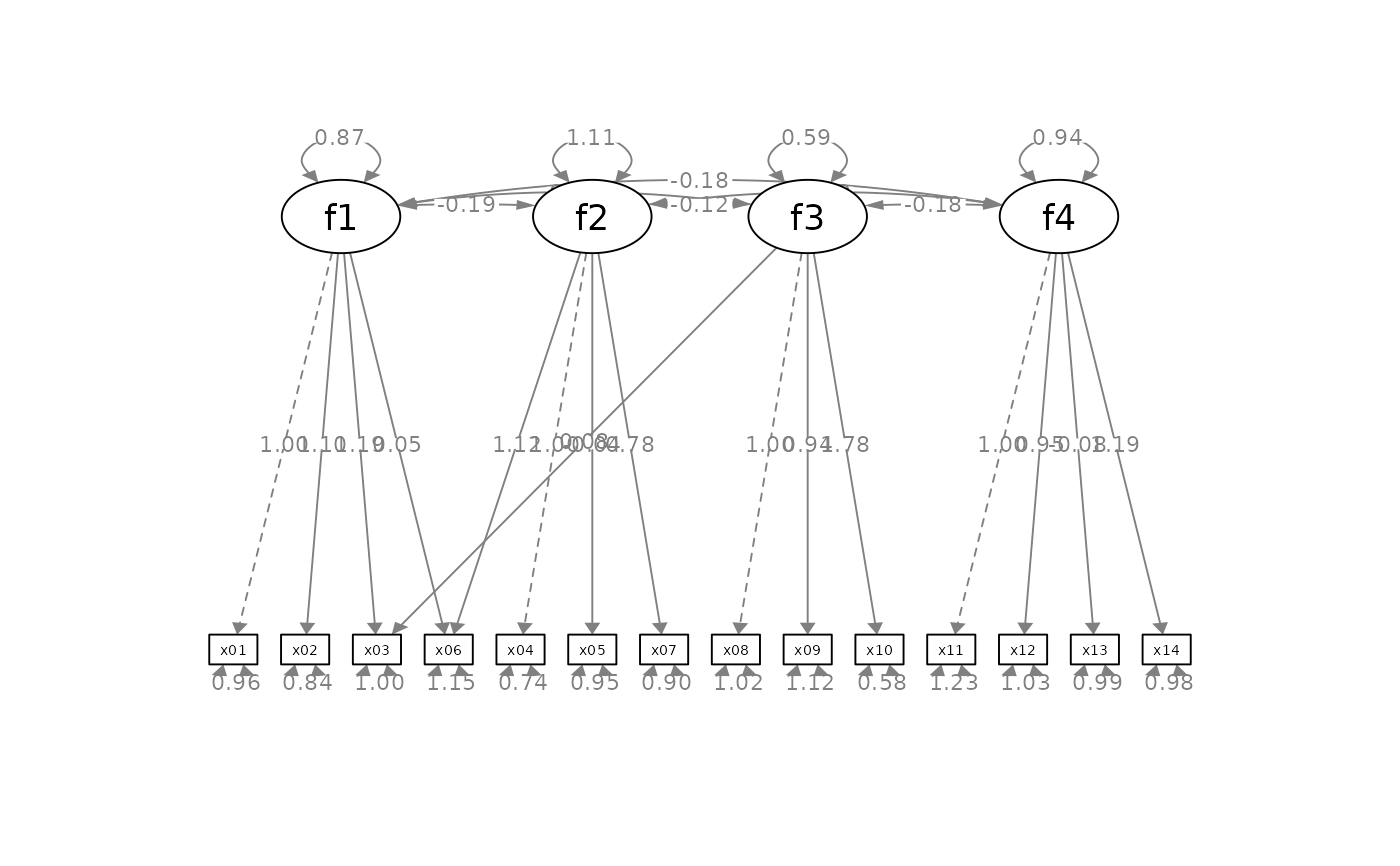
mod <-
'f1 =~ x01 + x02 + x03 + x06
f2 =~ x04 + x05 + x06 + x07
f3 =~ x08 + x09 + x10 + x03
f4 =~ x11 + x12 + x13 + x14
'
fit <- lavaan::cfa(mod, cfa_example)
p <- semPaths(fit,
whatLabels = "est",
sizeMan = 3.25,
node.width = 1,
edge.label.cex = .75,
mar = c(10, 5, 10, 5),
DoNotPlot = TRUE)
indicator_order <- auto_indicator_order(p)
indicator_order
#> f1 f1 f1 f1 f2 f2 f2 f3 f3 f3 f4 f4 f4
#> "x01" "x02" "x03" "x06" "x04" "x05" "x07" "x08" "x09" "x10" "x11" "x12" "x13"
#> f4
#> "x14"
p2 <- set_cfa_layout(p,
indicator_order = indicator_order)
plot(p2)
 # set_cfa_layout() will call auto_indicator_order()
# automatically if indicator_order is not set.
p3 <- set_cfa_layout(p)
plot(p3)
# set_cfa_layout() will call auto_indicator_order()
# automatically if indicator_order is not set.
p3 <- set_cfa_layout(p)
plot(p3)