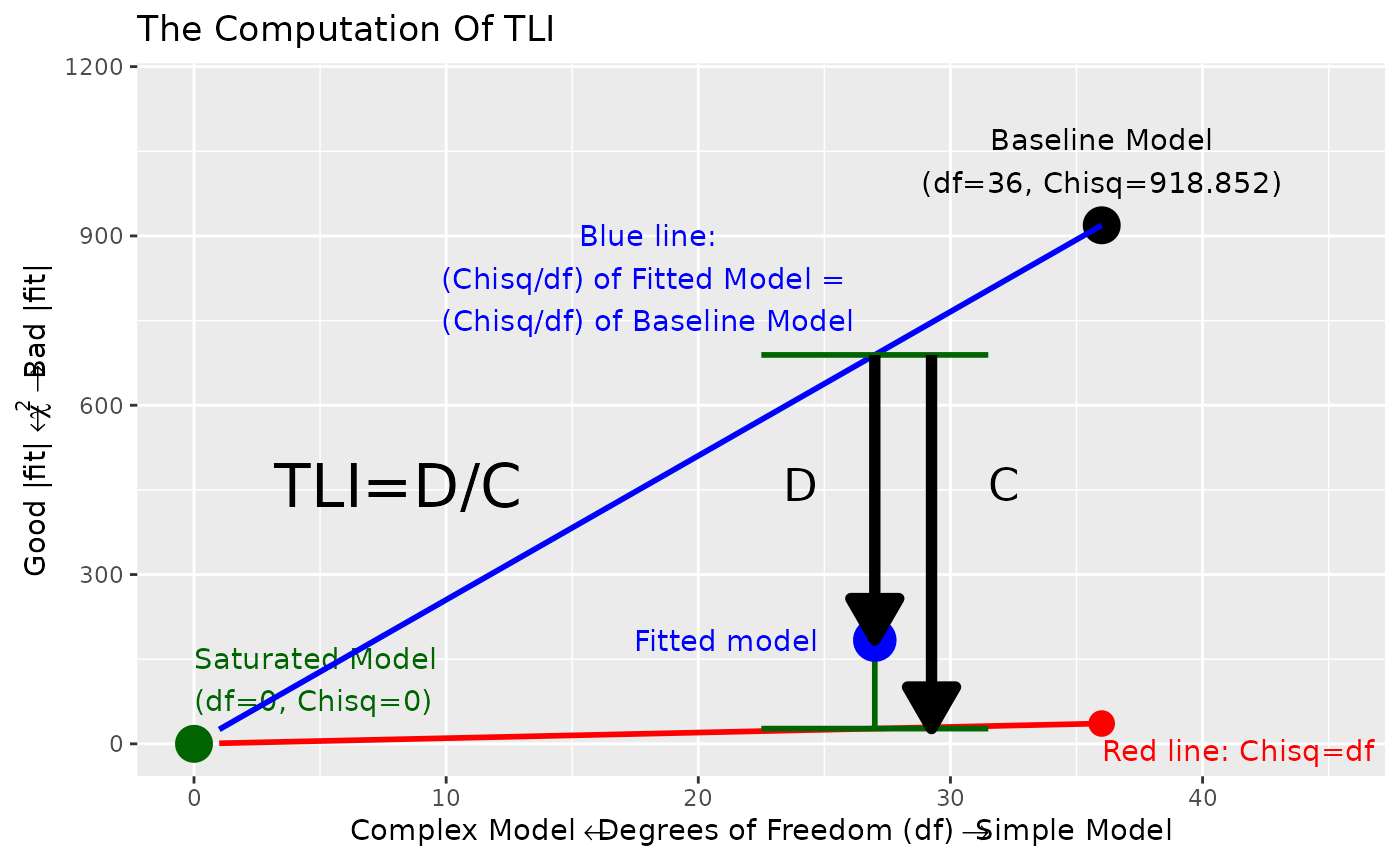
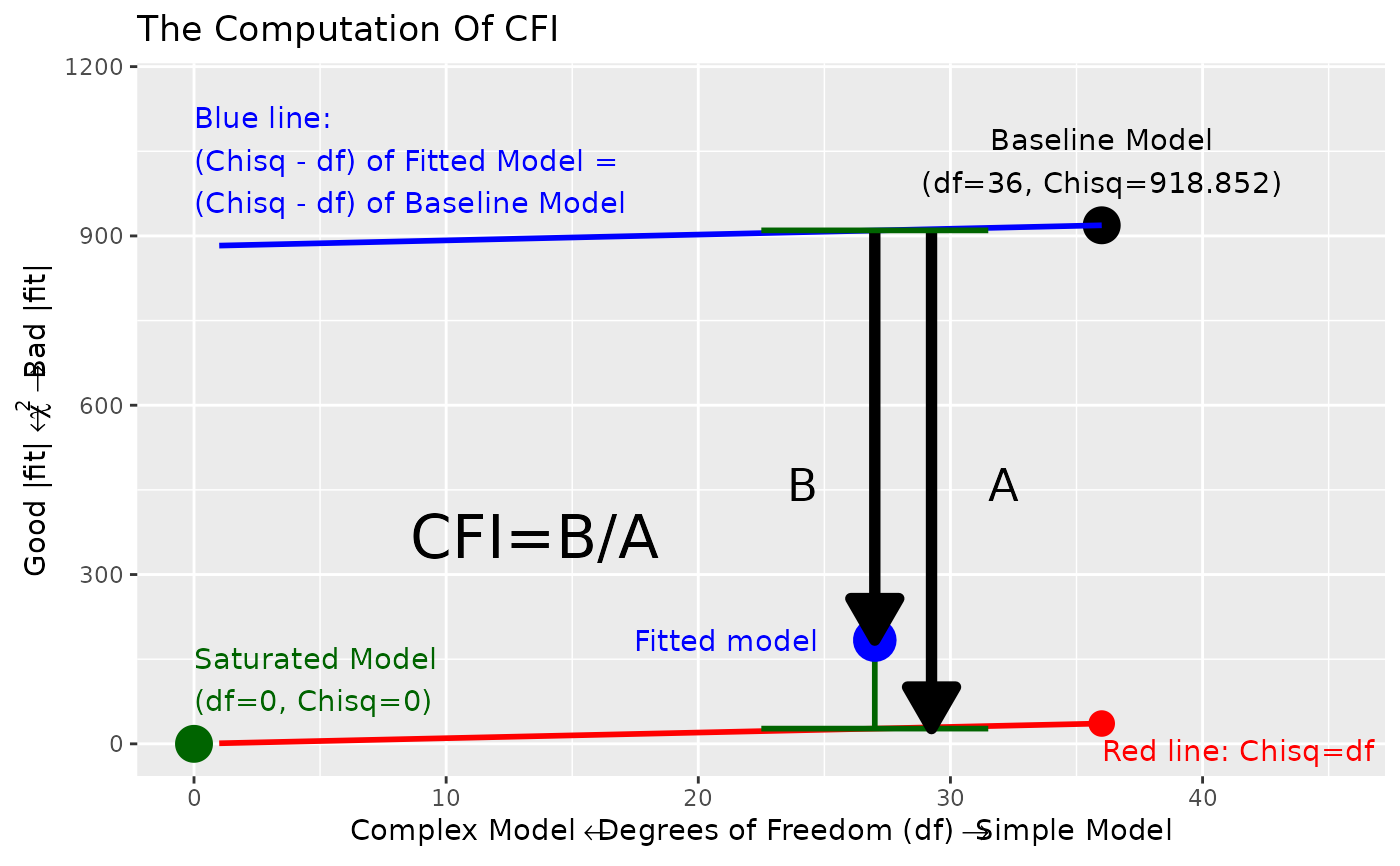
Show how CFI and TLI are computed using a graph of model chi-square vs. model degrees of freedom.
Arguments
- fit
An output of
lavaan::lavaan()or its wrappers (e.g.,lavaan::cfa()andlavaan::sem()).- ...
Arguments to be passed to
show_ifi().- fit_measures
The fit measures to be plotted. Acceptable values are
"cfi"and"tli".- test
The type of model chi-square test. It corresponds to the
testargument oflavaan::lavaan()or its wrappers. Only"standard"is supported for now.
Value
An output of
ggplot2::ggplot() that can be
further modified.
Details
This function receives an
output of lavaan::lavaan() or its
wrappers (e.g., lavaan::cfa()
and lavaan::sem()) and
illustrates how CFI is computed.
Functions
show_cfi(): A wrapper ofshow_ifi()withfit_measures = "cfi".show_tli(): A wrapper ofshow_ifi()withfit_measures = "tli".
Author
Shu Fai Cheung https://orcid.org/0000-0002-9871-9448
Examples
library(lavaan)
# From the help page of lavaan::cfa().
HS.model <- '
visual =~ x1 + x2 + x3
textual =~ x4 + x5 + x6
speed =~ x7 + x8 + x9
'
fit <- cfa(HS.model, data = HolzingerSwineford1939)
# By default show how CFI is computed
show_ifi(fit)
 # Show how TLI is computed
show_ifi(fit, fit_measures = "tli")
# Show how TLI is computed
show_ifi(fit, fit_measures = "tli")
 # Wrappers
show_cfi(fit)
# Wrappers
show_cfi(fit)
 show_tli(fit)